Figures & data
Table 1 The Multivariate Cox Analysis of the Nine Genes
Figure 1 A total of 81 DEGs were identified by the bioinformatic analysis of GSE64041 and GSE25097 datasets and significant functional analysis. (A) Heatmaps of the 81 DEGs identified from GSE64041 via clustering analysis. The red color represented high expression level, while the green color represents the opposite. Each row indicates the expression of a gene, while each column represents a sample. The red arrow indicated the location of our target gene. (B) Heatmaps of the 81 DEGs identified from GSE25097 via clustering analysis. The pink color represents a high expression level, while the light-purple color represents the opposite. Each row indicates the expression of a gene, while each column represents a sample. The red arrow indicated the location of our target gene. (C) GO enrichment analysis on 81 DEGs by R software. (D) GO enrichment analysis with P < 0.05 through metascape. (E) Hallmark analysis and KEGG Pathway and Canonical Pathways enrichment with P < 0.05 through metascape.
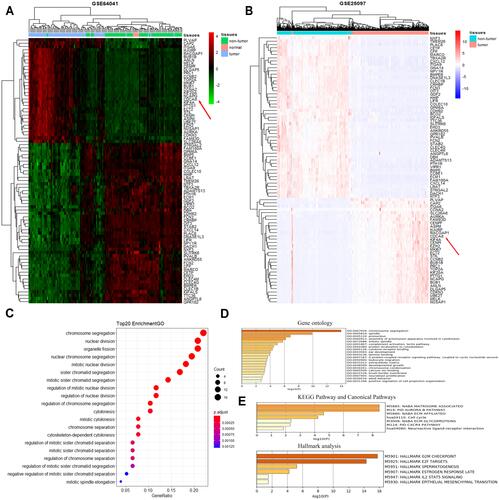
Figure 2 Borealin was upregulated in HCC tissues and correlated with poor survival. (A) Borealin was upregulated in the tumor tissues when compared with that in the non-tumor tissues in HCC by qRT-PCR analysis in 80 pairs tissues. (B) Borealin was highly expressed in HCC according to the TCGA data. (C) GSE64041 and GSE25097 databases displayed a higher expression of Borealin in the HCC tissues when compared with that in the non-tumor tissues. (D) WB revealed the protein expression of Borealin in the HCC tissues when compared with that in the non-tumor tissues. (E) IHC analysis showed the protein expression of Borealin in HCC tissues. (F and G) Kaplan-Meier analysis of overall survival rates of HCC patients in the TCGA database and our 80 tissue samples as stratified by Borealin expression. (H and I) Univariate and multivariate analyses with a Cox proportional hazard model for overall survival. (J) Representative signaling pathways of Borealin GSEA analysis. ES represents Enrichment score. NES represents Normalized Enrichment score. Error bars indicate SD. *p < 0.05; **p < 0.01; ***p < 0.001; ****p < 0.0001.
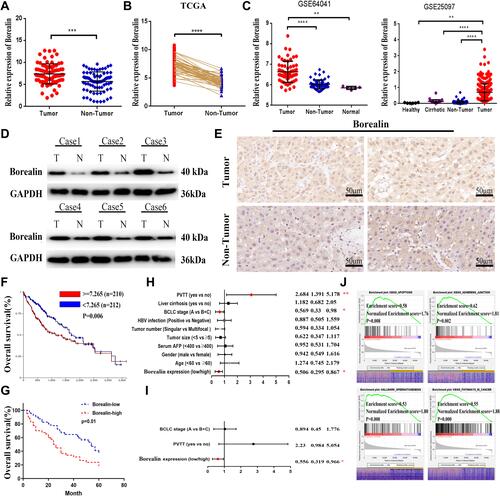
Table 2 Patients Clinical Characteristics
Figure 3 Borealin promoted cell proliferation, colony formation and inhibited cell apoptosis. (A and B) The transfection efficiency of siRNAs and plasmids was measured by qRT-PCR and WB analyses in SK-hep1 and Huh7 cells. (C) CCK8 assay showed that silencing of Borealin suppressed cell proliferation. Overexpressed Borealin upregulated proliferation ability of SK-hep1 cells. (D) Colony formation assay revealed that lower Borealin restrained the hepatoma cells colony formation ability. Borealin upregulated the clone formation ability of SK-hep1 cells. (E) FACS analysis explained higher apoptosis rates after impairing Borealin in hepatoma cells. Lower apoptosis rates were recorded after cells transfected with Borealin plasmid. Error bars indicate SD. *p < 0.05; **p < 0.01; ***p < 0.001.
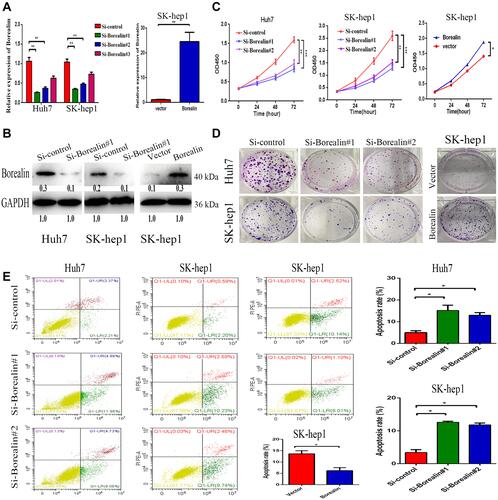
Figure 4 Borealin influenced migration, invasion and EMT in hepatoma cells. (A–D) By counting the migratory cells, we noted that the knockdown of Borealin reduced the migration and invasion abilities in in hepatoma cells. (E and F) Borealin enhanced cell migration and invasion as revealed by transwell assays in SK-hep1 cells. (G) WB assays analyzed the EMT-related molecules’ protein levels (E-cadherin, claudin-1 and vimentin) in Borealin-depleted Huh7 and SK-hep1 cells. Error bars indicate SD. **p < 0.01.
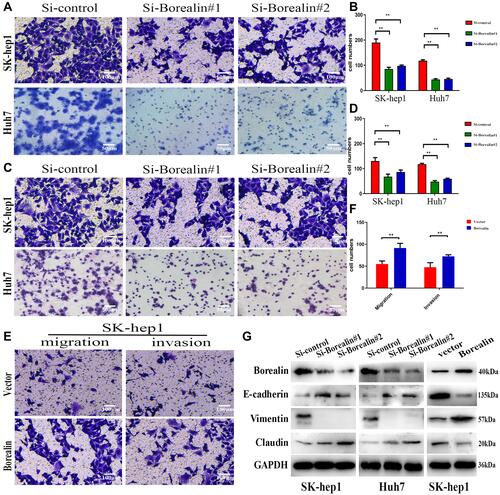
Figure 5 Borealin accelerated the hepatoma cells growth and migration in vivo. (A) The tumor growth curves overtime after implanting with HCCLM3 cells stably transfected with Borealin vector or control. (B) The higher Borealin group showed heavier tumor weight. (C) Representative images of the isolated tumors removed from nude mice implanted with HCCLM3 cells stably transfected with Borealin vector or control cells. (D) IHC analysis of Ki-67, BAX, vimentin and E-cadherin expression in tumors for analysis of tumor growth and EMT. (E) Borealin decreased hepatoma cells apoptosis in vivo by TUNEL assays. (F) Representative images of lung metastatic nodules in the Borealin and control groups. H&E staining confirmed that Borealin promoted the ability of HCC. Error bars indicate SD. *P < 0.05; **P < 0.01; ***p < 0.001.
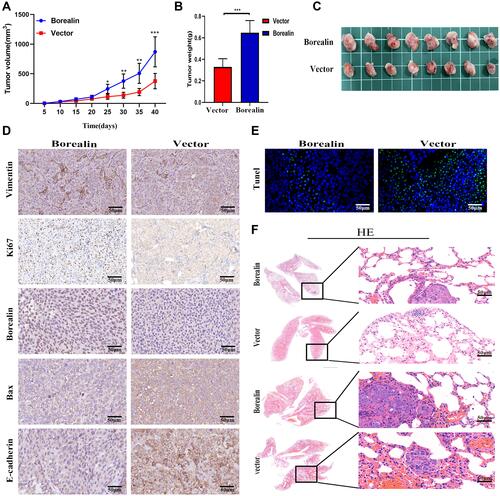
Figure 6 Borealin upregulated β-catenin and activated the Wnt/β-catenin signaling pathway to exert oncogenic function. (A) GSEA analysis indicated that Borealin might be involved in the Wnt/β-catenin signaling pathway. (B) Tissue expression data indicated significant correlation between the expression of Borealin and CTNNB1. (C and D) WB analysis signified enhanced β-catenin, c-Myc, cyclin-D1, and LGR5 expression and decreased RNF43 and AXIN2 expression in the Borealin overexpression group when compared with the control group in the hepatoma cells. (E) Overexpressed Borealin upregulated nucleus β-catenin by WB analysis of nucleoprotein from HCC cells. (F) Overexpressed Borealin upregulated nucleus β-catenin by immunofluorescence analysis. (G) The immunoprecipitation and WB assays suggested that β-catenin immunoprecipitated with Borealin in Huh7 and SK-hep1 cells.
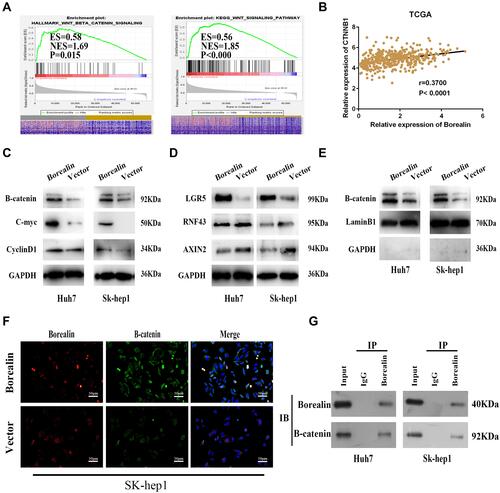
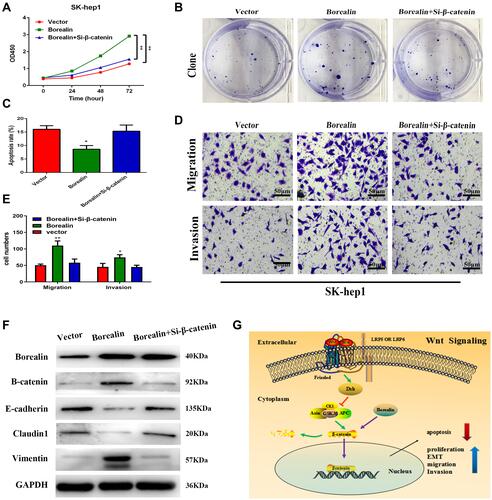
Figure 7 Borealin exerted oncogenic functions by activating the Wnt/β-catenin signaling pathway. (A) β-catenin interference significantly rescued the promotive proliferation ability caused by Borealin overexpression via the CCK-8 assay. (B) β-catenin interference significantly counteracted Borealin overexpression-promoted cell clone formation. (C) Si-β-catenin significantly rescued Borealin overexpression-inhibited ability on cell apoptosis. (D and E) Si-β-catenin reversed the promotive capacities of Borealin overexpression on migration and invasion as shown by transwell assay. (F) Si-β-catenin markedly neutralized the enhanced capacity on EMT by upregulated Borealin. (G) A schematic illustration showed that Borealin influenced cell proliferation, invasion and EMT via the Wnt/β-catenin signaling pathway in HCC. Error bars indicate SD. *P < 0.05; **P < 0.01.