Figures & data
Table 1 Demographic Data
Table 2 Measures of Dynamic Lymphocyte Changes Following Transarterial Radioembolization
Table 3 Evaluation of Correlation Between Post Treatment Lymphocyte Count and Treatment-Related Variables
Table 4 Receiver Operating Correlation Curve Analysis of Lymphocytes and Normal Liver Dose
Table 5 Comparison of Those Above and Below Normal Liver Dose Cutoffs as Determined by Receiver Operating Correlation Curve Analysis
Figure 1 (A) Kaplan–Meier overall survival curve comparing those with pretreatment absolute lymphocyte counts ≤1 103/µL or >1 103/µL (HR: 0.77, 95% CI: 0.47–124, p=0.28). (B) Kaplan–Meier overall survival curve comparing those with absolute lymphocyte counts ≤1 103/µL or >1 103/µL at 1 month post treatment (HR: 0.56, 95% CI: 0.33–0.95, p=0.03). (C) Kaplan–Meier overall survival curve comparing those with absolute lymphocyte counts ≤1 103/µL or >1 103/µL at 3 months post treatment (HR: 0.41, 95% CI: 0.18–0.94, p=0.035). (D) Kaplan–Meier overall survival curve comparing those with absolute lymphocyte counts ≤1 103/µL or >1 103/µL at 6 months post treatment (HR: 0.36, 95% CI: 0.17–0.77, p=0.008). (E) Kaplan–Meier overall survival curve comparing those with absolute lymphocyte counts ≤1 103/µL or >1 103/µL at 12 months post treatment (HR: 0.52, 95% CI: 0.21–1.28, p=0.15).
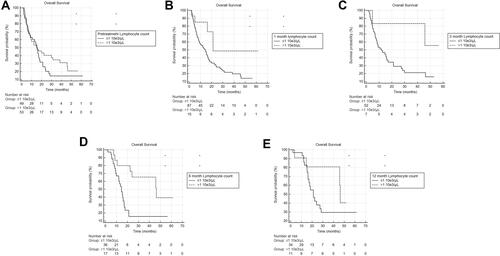
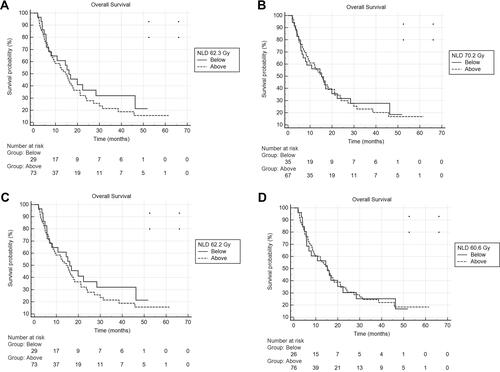
Figure 2 (A) Kaplan–Meier overall survival curve comparing those with normal liver dose of less than or greater than 62.3 Gy (HR: 1.23, 95% CI: 0.74–2.05, p=0.41). (B) Kaplan–Meier overall survival curve comparing those with normal liver dose of less than or greater than 70.2 Gy (HR: 1.03, 95% CI: 0.63–1.69, p=0.90). (C) Kaplan–Meier overall survival curve comparing those with normal liver dose of less than or greater than 62.2 Gy (HR1.23, 95% CI: 0.74–2.05, p=0.42). (D) Kaplan–Meier overall survival curve comparing those with normal liver dose of less than or greater than 60.6 Gy (HR0.98, 95% CI: 0.58–1.68, p=0.95).