Figures & data
Figure 1 Flowchart of patients’ enrollment.
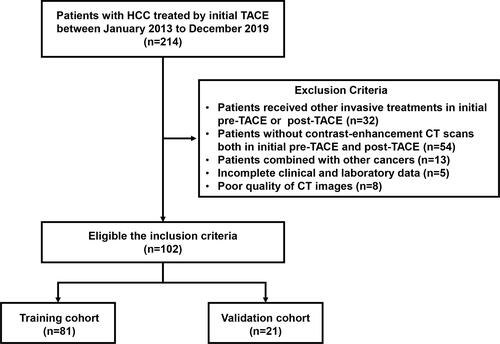
Figure 2 Overview of radiomics analysis in this study. The volume of interest (VOI) was formed after region of interest (ROI) outlining on the arterial phase of CT enhancement. Features were extracted from the VOI and selected using least absolute shrinkage and selection operator (LASSO) regression. A combined radscore-clinical model was developed to predict overall survival (OS) in patients with hepatocellular carcinoma (HCC) after transarterial chemoembolization (TACE), and a Kaplan–Meier (K-M) stratification analysis of risk factors for predicting OS was performed.
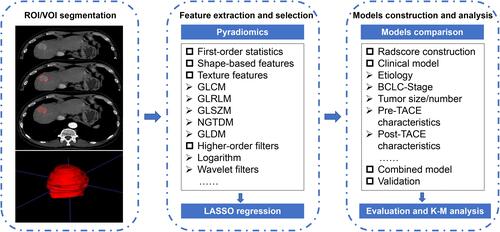
Table 1 Characteristics of Patients in the Training and Validation Cohorts
Table 2 Characteristics of Each Radiomics Feature Extracted and Corresponding Coefficients for Predicting Overall Survival (N = 102)
Figure 3 The results of least absolute shrinkage and selection operator (LASSO) regression. (A) Mean squared error (MSE) path. (B) Lasso path, 9 optimal radiomics features were selected to calculate the radscore.
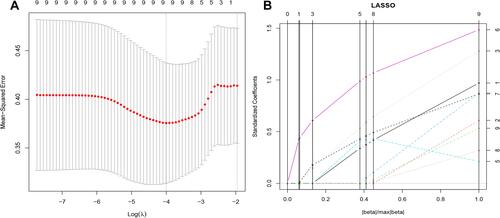
Table 3 Univariate and Multivariate Cox Regression Analysis for Predicting Overall Survival in Hepatocellular Carcinoma Treated by Transarterial Chemoembolization in the Training Cohort
Table 4 Predictive Performance of the Survival Models
Figure 4 Development and validation of the model. (A) The nomogram of combined model for predicting overall survival (OS) was consisting of post-response (1= complete response, 2 = partial response, 3 = stable disease, 4 = progressive disease) and radscore, with a C-index of 0.806 (95% CI: 0.697–0.953) in the training cohort. The calibration curve demonstrating predictions from the model to the actual observed probability in the training cohort (B) and validation cohort (C).
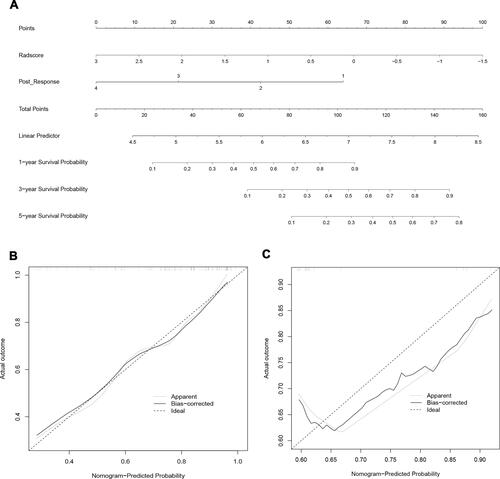
Figure 5 Decision curve analysis of the models. The net benefit of both the radscore and combined model are higher than that of clinical model.
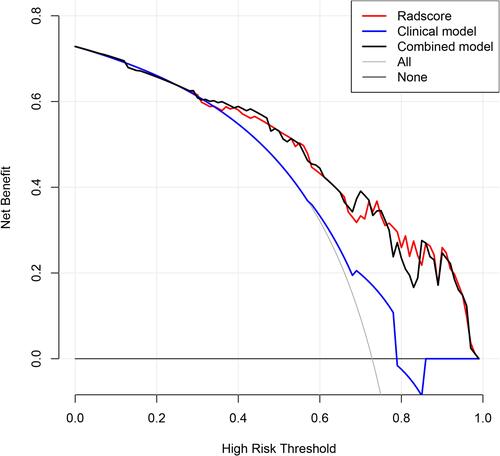
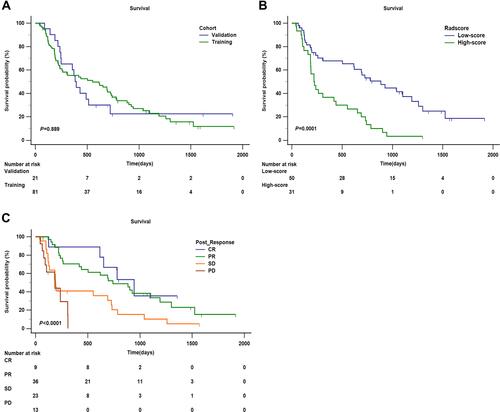
Figure 6 Kaplan–Meier analysis of overall survival (OS). (A) Kaplan–Meier analysis of OS between training cohort and validation cohort (P = 0.889). (B) Kaplan–Meier analysis of OS of radscore (low-score and high-score) divided by the cut-off value (1.36) in the training cohort (P = 0.0001). (C) Kaplan–Meier analysis of OS of post-response evaluated by mRECIST (CR, PR, SD, and PD) in the training cohort (P < 0.0001).