Figures & data
Table 1 Oligonucleotide Primer Sets Used to Generate Scrambled shRNA and RBM3 shRNA
Table 2 Correlation of Clinical Features and Clinicopathological Parameters of the Hepatocellular Carcinoma Patients and RBM3 Expression Analyzed by IHC
Figure 1 High expression of RBM3 is correlated with poor prognosis and shorter overall survival. (A) Representative images of RBM3 expression in tumor tissues and adjacent noncancerous tissues by immunohistochemical staining (magnification × 200). (B and C) Pie chart of IHC results of RBM3 expression in noncancerous and tumor tissues of 90 HCC patients. (D) Statistics of immunohistochemical staining for relative RBM3 expression in HCC tissues (n=85) and corresponding adjacent healthy tissues (n=85). Five HCC tissues and five healthy tissues showed a score of 0, so their log2 results are not exhibited. (E) Kaplan–Meier curves of cumulative survival plots for 88 HCC patients (two patients were lost to follow-up), including 58 patients with high RBM3 expression and 30 patients with low RBM3 expression. (F) Relative RBM3 expression in normal participants (n=50) and HCC patients (n=374) in the TCGA database. (G) Kaplan–Meier survival curves of cumulative survival plots for HCC patients from the TCGA database. The 350 HCC patients who participated in it included 144 patients with high RBM3 expression and 206 patients with low RBM3 expression. (H) Correlation between RBM3 expression and tumor progression from the TCGA database (stage I, n=173; stage II, n=87; stage III, n=85; stage IV, n=5). The log-rank (Mantel-Cox) test was used to compare differences between two groups. Error bar: mean ± SEM. *P < 0.05.
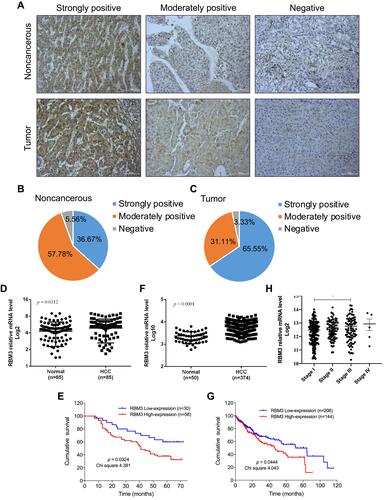
Figure 2 RBM3 promotes the EMT process in HCC cells. (A) Western blotting analysis of RBM3 expression in normal human liver cell HL-7702, hepatocellular carcinoma cells HepG2 and MHCC97H. (B) The expression of RBM3 in HepG2-EGFP cells and HepG2-RBM3 cells was detected by Western blotting. Stable cell lines were constructed by infecting HepG2 cells with lentivirus and screening with 2 μg/mL puromycin for 1–2 weeks. (C) Western blotting analysis of the expression of EMT-related factors in HepG2-EGFP cells and HepG2-RBM3 cells. (D) Knockdown efficiency of 4 designed siRNAs for RBM3 expression in MHCC97H cells. (E) Western blotting analysis of RBM3 expression in MHCC97H cells transfected with a mixture of RBM3-specific siRNA#1 and #3. (F) Western blotting analysis of EMT markers was performed in MHCC97H cells transfected with non-specific siRNAs or RBM3-siRNAs. siRNA was added to the cells for 6 hours and total protein was collected after 48 hours. Relative levels of RBM3, E-cadherin, N-cadherin and Vimentin were quantitatively analyzed using Image J. Results are the mean ± SEM (error bar) from three independent experiments. *P < 0.05, **P < 0.01, ***P < 0.001.
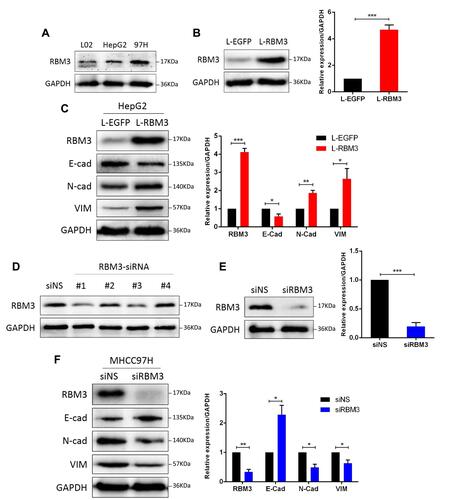
Figure 3 RBM3 accelerates the migration and invasion in HCC cells. (A) Transwell assay for migration and invasion ability of HepG2-RBM3 cells and control HepG2-EGFP cells. Each chamber was plated with 104 cells, and the number of cells was checked after 24 hours. (B) Transwell assay for migration and invasion of MHCC97H cells transfected with non-specific siRNAs or RBM3-siRNAs. MHCC97H cells were transfected with siRNAs for 6 hours, and replaced with fresh DMEM medium and incubated for 48 hours. Then cells were digested into single cell suspensions, 104 cells per chambers were plated and the number of cells was checked after 24 hours. (C and D) Western blotting of metastasis-related factors, MMP2, MMP9 and VEGF in HepG2-EGFP/RBM3 cells and MHCC97H cells transfected with non-specific/RBM3-specific siRNAs. Total proteins were collected after 48 hours. Relative levels of MMP2, MMP9 and VEGF were quantitatively analyzed using Image J. Scale bar, 200 μm. Results are the mean ± SEM (error bar) from three independent experiments. *P < 0.05, **P < 0.01, ***P < 0.001.
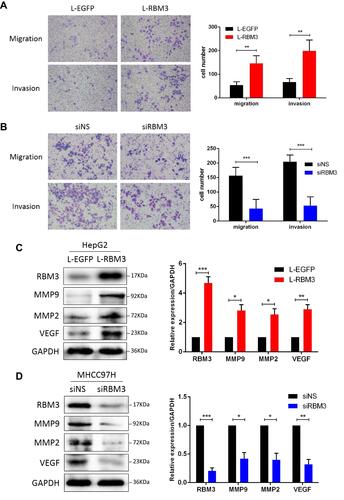
Figure 4 STAT3 signaling pathway is involved in RBM3-induced EMT. (A and B) Western blotting analysis of the expression of EMT-related factors, total STAT3 and STAT3 phosphorylation in HepG2-EGFP/RBM3 cells and MHCC97H cells transfected with non-specific siRNA or RBM3-specific siRNA. siRNA was added to MHCC97H cells for 6 hours, and total protein was collected after incubating 48 hours. (C) Western blotting analysis of the inhibitory efficiency of phosphorylation of STAT3 by S3I-201. The concentrations were 0, 50, 100 and 200 μM. Total protein was collected after treating with S3I-201 for 72 hours. (D) Western blotting analysis of the expression of EMT-related factors, total STAT3 and STAT3 phosphorylation in total cell lysates prepared from HepG2-EGFP and HepG2-RBM3 cells treated with 50 μM S3I-201 for 72 hours. (E) Western blotting analysis of the knockdown efficiency of two STAT3-specific siRNAs on STAT3 expression in HepG2 cells. siRNA was added to HepG2 cells for 6 hours, and total protein was collected after 72 hours. (F) Western blotting analysis of indicted proteins in HepG2-EGFP and HepG2-RBM3 cells transfected with non-specific siRNA or STAT3-siRNA for 72 hours. (G) RT-PCR of RIP products verified the binding capacity of RBM3 to STAT3 mRNA in HepG2-RBM3 cells. (H) qRT-PCR of RIP products further confirmed the binding capacity of RBM3 to the mRNA of STAT3 (n=3). (I) Stability of STAT3 mRNA was analyzed by qRT-PCR. After transfection with non-specific siRNA or RBM3-siRNA for 48 hours, MHCC97H cells were treated with 5 μM actinomycin D for 0, 20, 40 and 60 min, and total RNA was collected at certain time. Results are the mean from three independent experiments. (J) Correlation of RBM3 and STAT3 in HCC patients (n=374) from TCGA database. Pearson correlation analysis was used. Relative levels of E-cadherin, N-cadherin, Vimentin, p-STAT3 and total STAT3 were quantitatively analyzed using Image J. Relative p-STAT3 level was the ratio of STAT3 phosphorylation to total STAT3, the relative levels of other proteins were the ratio to GAPDH. Results are the mean ± SEM (error bar) from three independent experiments. *P < 0.05, **P < 0.01, ***P < 0.001.
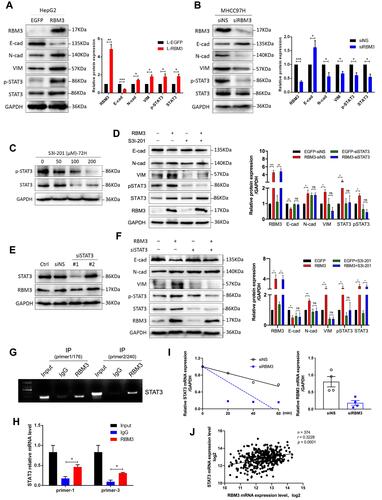
Figure 5 microRNA-383 suppresses downstream targets of RBM3 by binding to the 3’ UTR of RBM3. (A) Schematic diagram of the combination of microRNA-383 and RBM3 3ʹUTR. (B) Western blotting analysis of RBM3 expression in HepG2 cells transfected with nothing, pLKO.1-ns or pLKO.1-microRNA-383 plasmids. (C) Luciferase assays were performed to detect the binding activity of microRNA-383 and RBM3 3ʹUTR. Relative fold-change in luciferase activity is shown. (D) Western blotting analysis of RBM3 downstream targets (E-cadherin, MMP9 and VEGF) in HepG2-pLKO.1 cells and HepG2-pLKO.1-microRNA-383 cells. (E) Expression of microRNA-383 in normal participants (n=49) and primary LIHC tumors (n=369) from the TCGA database. (F) Correlation of microRNA-383 and RBM3 from TCGA database. Excluding samples with a miR-383 read of 0, a total of 128 LIHC samples were included in the statistics. Pearson correlation analysis was used. Results are the mean ± SEM (error bar) from three independent experiments. *P < 0.05, ***P < 0.001.
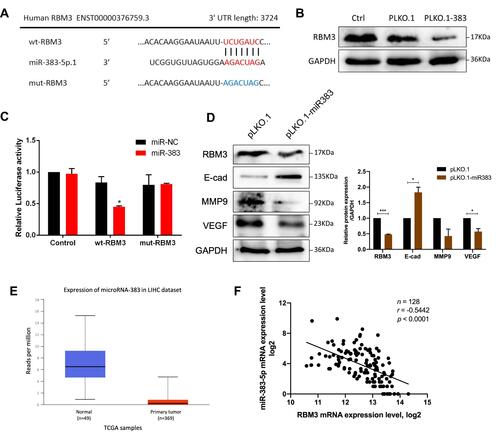
Figure 6 RBM3 inhibition prolongs the survival of mice burdened with HCC xenograft tumors. (A) Construction of HepG2 cells stably overexpressing RBM3. (B) The expression of RBM3 in MHCC97H-scrambled-shRNA cell and MHCC97H-RBM3-shRNA#2 cell was detected by Western blotting. (C) Kaplan–Meier curves of cumulative survival plot of nude mice injected with HepG2-pLNCX2 cells and HepG2-pLNCX2-RBM3 cells (n=6–7 mice per group). (D) Kaplan–Meier curves of cumulative survival plot of nude mice injected with MHCC97H-scrambled-shRNA cells and MHCC97H-RBM3-shRNA #2 cells (n=6–7 mice per group). (E) Representative gross images of livers with metastatic nodules (top), H&E-stained sections (second row) and IHC analysis of STAT3 and EMT markers (E-cadherin, N-cadherin and Vimentin) of the indicated HCC xenografts. Scale bar, 200 μm. P<0.05, statistically significant.
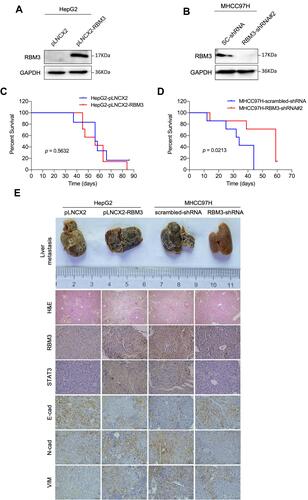
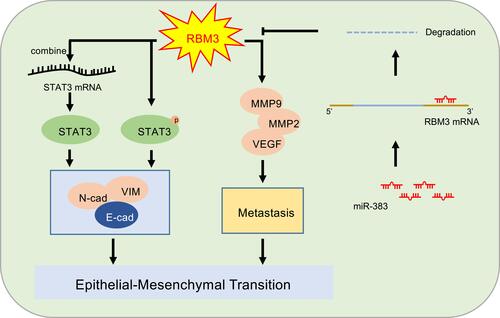
Figure 7 Mechanism model of EMT-regulated by RBM3 in HCC. RBM3 promotes the EMT process by activating STAT3 signaling pathway in two ways. One is that RBM3 upregulates STAT3 expression by binding to STAT3 mRNA, and the other is that RBM3 increases the phosphorylation of STAT3. Moreover, RBM3 accelerates the migration and invasion of HCC cells, and upregulates MMP9, MMP2 and VEGF expression. Furthermore, as an upstream target of RBM3, microRNA-383 inhibits RBM3 expression by binding to the 3ʹUTR of RBM3 mRNA.