
Figures & data
Figure 1 Derivation of the study population and case-cohort sample.
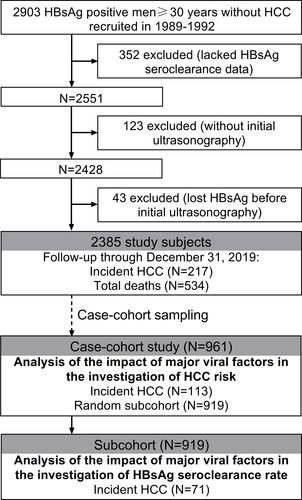
Table 1 Baseline Characteristics of Study Subjects and Main Outcomes
Table 2 Baseline Factors Associated with HBsAg Seroclearance
Figure 2 Additive joint effect between excess BMI, PNPLA3 148M-variant, and hepatic steatosis on the probability of HBsAg seroclearance. (A) Cumulative incidence function curve of HBsAg seroclearance according to a prognostic score ranging from 0 to 5 (points: BMI [normal weight/underweight=0, overweight=1, obesity=2]; PNPLA3 [II=0, MI=1, MM=2]; steatosis [No=0, yes=1]). (B) Sub-distribution hazard ratios (sHRs) with 95% CIs estimated from competitive risk Cox model. Solid circles and lines indicated sHRs and 95% CIs. sHRs derived from the entire cohort were adjusted for age, ALT, history of liver disease, diabetes, cigarette smoking, and alcohol consumption. sHRs derived from the subcohort were further adjusted for HBeAg, viral load, HBV genotype (C vs non-C), and BCP double mutations.
![Figure 2 Additive joint effect between excess BMI, PNPLA3 148M-variant, and hepatic steatosis on the probability of HBsAg seroclearance. (A) Cumulative incidence function curve of HBsAg seroclearance according to a prognostic score ranging from 0 to 5 (points: BMI [normal weight/underweight=0, overweight=1, obesity=2]; PNPLA3 [II=0, MI=1, MM=2]; steatosis [No=0, yes=1]). (B) Sub-distribution hazard ratios (sHRs) with 95% CIs estimated from competitive risk Cox model. Solid circles and lines indicated sHRs and 95% CIs. sHRs derived from the entire cohort were adjusted for age, ALT, history of liver disease, diabetes, cigarette smoking, and alcohol consumption. sHRs derived from the subcohort were further adjusted for HBeAg, viral load, HBV genotype (C vs non-C), and BCP double mutations.](/cms/asset/10a22a26-f1dd-444e-8064-f4e9177c3dff/djhc_a_12169304_f0002_c.jpg)
Table 3 Multivariate-Adjusted sHRs of HCC Derived from the Entire Cohort and the Case-Cohort Analysis
Table 4 Associations of Hepatic Steatosis at Baseline and PNPLA3 p.I148M Variation with Risk of HCC by Follow-Up Timea
Table 5 Longitudinal Cohort Analysis for Factors Associated with Episodes of Liver Enzyme Elevation and Liver Cirrhosis Detected by Imaging Modalitiesa, b