
Figures & data
Table 1 Clinical and Histological Features of Nine Hepatoma Cell Lines
Figure 1 The four tyrosine kinase inhibitors, sorafenib, lenvatinib, regorafenib, and cabozantinib, cause a reduction in cell viability in all nine cell lines. (A) Effect of sorafenib on all cell lines with a concentration range of 0.31μM to 5μM in a 1:2 serial dilution. (B) Effect of lenvatinib on all cell lines with a concentration range of 0.25μM to 20μM in a 1:3 serial dilution. (C) Effect of regorafenib on all cell lines with a concentration range of 0.31μM to 5μM in a 1:2 serial dilution. (D) Effect of cabozantinib on all cell lines with a concentration range of 1.25μM to 20μM in a 1:2 serial dilution. Potency (GR50 values) for (E) sorafenib, (F) lenvatinib, (G) regorafenib, and (H) cabozantinib. Results are presented as the mean and standard deviation for at least three experiments. P<0.05 for all drugs by analysis of variance (ANOVA). Due to the increased proliferation of Snu475 under sorafenib and regorafenib at the lower concentrations and to better fit the representation in this graph, we do not show Snu475 at said lower concentrations. The complete dose–response curves of Snu475 can be seen in Supplementary Figure 1.
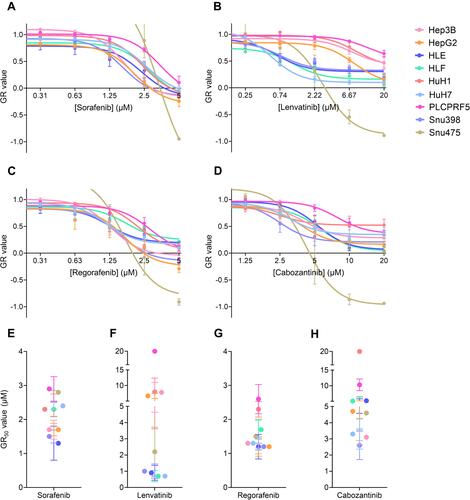
Table 2 GR Values for Potency and Efficacy
Figure 2 Gene differential expression values compared to treatment groups. This heatmap shows the differential expression values for each drug. The scale is measured in expression fold changes (FC) in relation to the standardized expression profiles of the original cell lines after being analyzed with the DESeq2 algorithm. The dark colors represent FC values between 0 and ± 10, and the lighter colors present FC values over ± 10. At the left, the blue rectangle includes two clusters tinted in light green and red in all the treatment groups, suggesting two identifiable gene expression signatures: the left one, with overexpression in four groups (sorafenib [S], regorafenib [R], cabozantinib [C] and lenvatinib [L]) and underexpression in those that responded differentially better to regorafenib than sorafenib (RoS), and the right one, with genes highly underexpressed in the first three groups ((S), (R), and (C) and overexpressed in the last two (L and RoS).
![Figure 2 Gene differential expression values compared to treatment groups. This heatmap shows the differential expression values for each drug. The scale is measured in expression fold changes (FC) in relation to the standardized expression profiles of the original cell lines after being analyzed with the DESeq2 algorithm. The dark colors represent FC values between 0 and ± 10, and the lighter colors present FC values over ± 10. At the left, the blue rectangle includes two clusters tinted in light green and red in all the treatment groups, suggesting two identifiable gene expression signatures: the left one, with overexpression in four groups (sorafenib [S], regorafenib [R], cabozantinib [C] and lenvatinib [L]) and underexpression in those that responded differentially better to regorafenib than sorafenib (RoS), and the right one, with genes highly underexpressed in the first three groups ((S), (R), and (C) and overexpressed in the last two (L and RoS).](/cms/asset/bdb857aa-177e-4000-bd8c-059e9f0f7ce2/djhc_a_12169305_f0002_c.jpg)
Table 3 KEGG and IPA enriched pathways by treatment group.
Table 4 Gene Expression Signature Candidate