Figures & data
Table 1 Baseline Patient Characteristics
Figure 1 Time-dependent ROC curve analysis comparing the ability of AABR, AHLR, FF-HL, AB-HL, FF-AB, FFAR and AFP in predicting (A) overall survival, (B) disease-free survival and (C) progress-free survival. The horizontal axis represents time and the vertical axis represents the area under the corresponding ROC curves for survival at different time points.
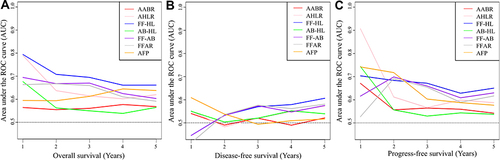
Figure 2 Differences in overall survival (OS) (A–D; blue color: the low groups, green color: the high groups) and progression-free survival (PFS) (E–H; purple color: the low groups, Orange color: the high groups) between these eight subgroups were assessed in patients in the high and low level AABR, AHLR, FF-HL and HDL-C groups. The median OS was 10.1 vs 8.4 years in low and high AABR group (A), 15.0 vs 5.1 years in low HDL-C (D). The median PFS was 5.3 vs 6.5 months in low and high AABR group (E), 7.3 vs 3.2 months in low and high AHLR group (F), 7.6 vs 3.5 months low and high FF-HL group (G), and 5.9 vs 7.8 months in low and high HDL-C groups (H). P < 0.001 in red was statistically significant.
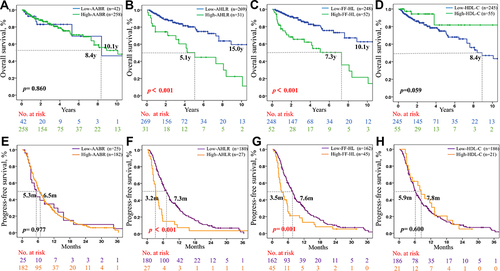
Figure 3 Comparison of DFS, CDFS, actuarial DFS, and annual rate of death in the high-level AABR, low-level AHLR, and low-level FF-HL groups. (A, E and I) represent the DFS of AABR, AHLR, and FF-HL groups in the total population, respectively; (B, F and J) represent the 3-year conditional survival rate and the 3-year actuarial DFS rate, respectively; (C, G and K) represent the conditional survival curves of patients who have survived 1–9 years of survival, respectively; (D, H and L) represent smoothed hazard plots of annual rate of death for each group, respectively.
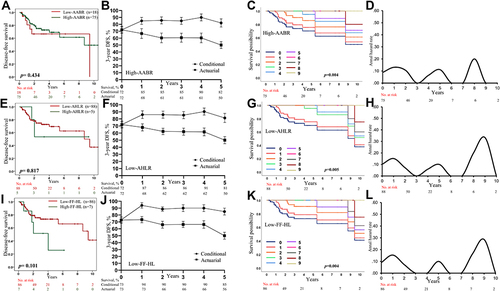
Table 2 Univariable and Multivariable Analyses to Determine Independent Predictors of Overall Survival and Progress-Free Survival
Figure 4 Subgroup analysis using univariate Cox regression was performed to assess the ability of FF- HL to discriminate OS in patients with different clinical characteristics.

Figure 5 DFS and CDFS curves for the whole cohort. (A) DFS curves; (B) 3-year CDFS and 3-year actuarial DFS; (C) CDFS curves for 1–9 years of survival, respectively. (D) Smoothed hazard plot for annual rate of death.
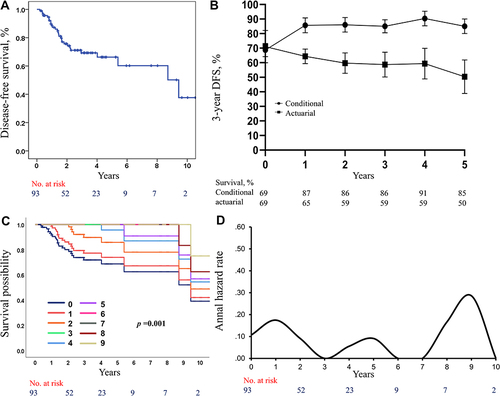
Figure 6 OS and COS curves for the whole cohort. (A) OS curves; (B) 3-year COS and 3-year actuarial OS; (C) COS curves for 1–9 years of survival, respectively. (D) Smoothed hazard plot for annual rate of death.
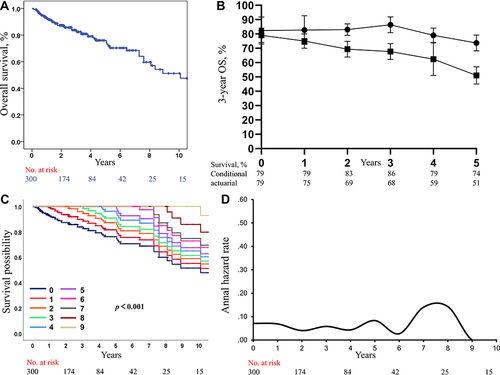
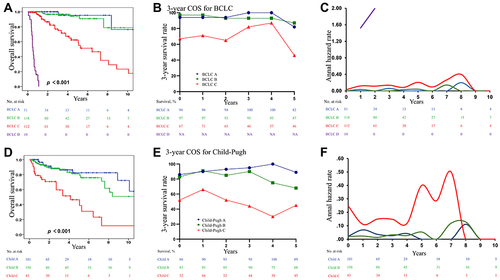
Figure 7 Analysis of OS and COS based on BCLC method (A–C) and risk stratification of Child-Pugh score (D–F). OS curves (A), 3-year COS for re-survival 1–5 years (B), and smoothed hazard plots for annual rate of death (C) based on BCLC system; (D) OS curves (D), 3-year conditional COS for re-survival 1–5 years (E), smoothed hazard plots for annual rate of death (F) based on Child-Pugh score.