Figures & data
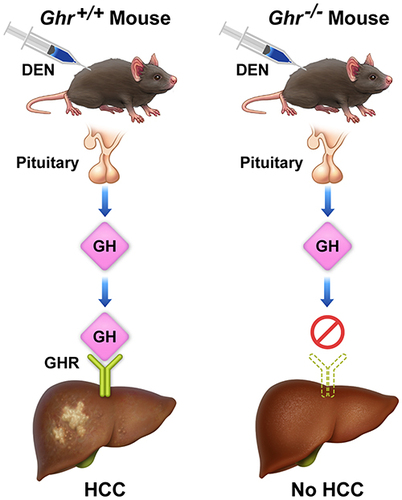
Figure 1 Genotypic and phenotypic features of mice after global and liver-specific disruption of the Ghr gene. (A) Global (Ghr) and (B) liver-specific disruption of Ghr (LiGhr) was confirmed by genotyping using conventional polymerase chain reaction (PCR) from genomic DNA isolated from mice tails as described previously (smaller band denotes Ghr+/+ mice while the larger band denotes Ghr−/− mice). Body sizes of representative mice examples from (C) the global Ghr+/+, Ghr+/-, and Ghr−/−; and (D) the liver-specific LiGhr+/+, LiGhr+/-, and LiGhr−/− mice genotypes. Body weights of mice from the (E) global (n=31 in Ghr+/+, n=31 in Ghr+/-; n=18 in Ghr−/−); and (F) LiGhr+/+, LiGhr+/-, and LiGhr−/− (n=25 in each group) genotype groups. (G) Levels of Ghr mRNA in the livers from global (n=3 in Ghr+/+, n=2 in Ghr+/-, n=3 in Ghr−/−); and (H) liver-specific (n=2 in LiGhr+/+, n=3 in LiGhr+/-, n=3 in LiGhr−/−) genotype groups. Results are shown as means ± SE.
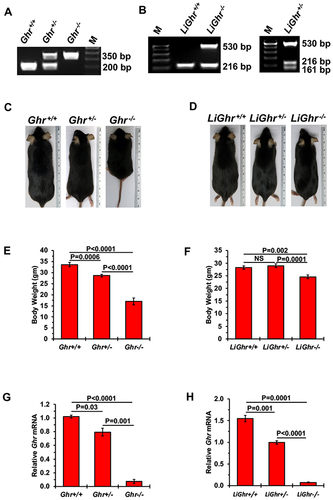
Figure 2 Effects of the Ghr gene disruption on HCC development. (A) DEN-induced HCC mouse model. Mice were injected with DEN (25 mg/kg), or saline as control, on postnatal day 14 and maintained until they became 36–40 weeks old. (B) Representative examples of livers from global (upper row) and liver-specific genotypes mice (lower row) injected with DEN. Control Ghr+/+ and LiGhr+/+ mice were injected with saline only. For the Ghr global genotype, the liver weight-to-body weight ratios, number of mice with or without tumors, percentage of mice with HCC, and the number of tumors developed after DEN injection are shown in (C–F) respectively. For the LiGhr liver-specific genotype, the liver weight-to-body weight ratios, number of mice with or without tumors, percentage of mice with HCC, and the number of tumors developed after DEN injection are shown in (G–J) respectively. Results are shown as means ± SE in (C, F, G, and I), and as means in (D and H).
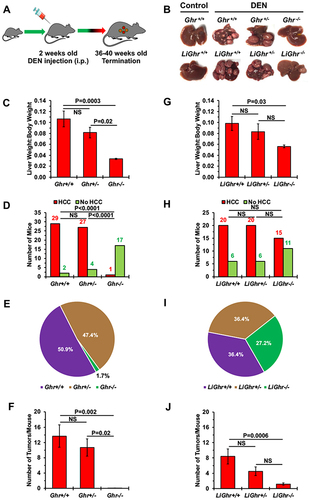
Figure 3 DEN-induced HCC in Ghr+/+ and Ghr+/- mice resembles to a great extent human HCC. Representative examples of hematoxylin and eosin-stained liver sections from (A, upper and lower panels) Ghr+/+, (B, upper and lower panels) Ghr+/-, and (C) Ghr−/− mice that were injected with DEN. (D) Liver sections from a control Ghr+/+ mouse that was not injected with DEN is also shown as an example. Arrows highlight HCC tumor nodules in the Ghr+/+ and Ghr+/- liver tissues. There are foci of markedly increased mitotic figures (arrowheads). HCC is not present in the livers from the Ghr−/− mouse treated with DEN and the Ghr+/+ control mouse that was not treated with DEN. PT and CV denote portal tract and central vein, respectively. (E) IHC staining with Ki-67 shows increased PI in HCC that developed in Ghr+/+ and Ghr+/- mice after DEN injection, compared with low PI in liver tissues from Ghr−/− mice that were also injected with DEN, yet did not develop HCC. (F) The means ± SE of the numbers of Ki-67+ cells per HPF. The H&E photomicrographs were captured using the NanoZoomer S50 Digital slide scanner (Hamamatsu, Bridgewater, NJ), and the Ki-67 photomicrographs using an Olympus BX41 microscope (Olympus Scientific Solutions Americas Corp., Waltham, MA), Infinity 3 camera (Teledyne Lumenera, Ottawa, Ontario, Canada), and Infinity Capture software (version 6.3.2., Teledyne Lumenera). Original magnifications are shown.
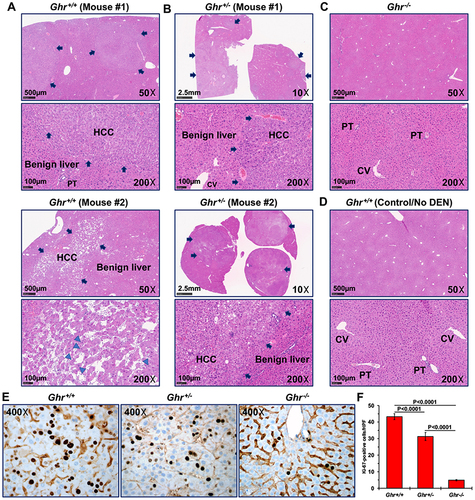
Figure 4 Biochemical findings in Ghr+/+ and Ghr−/− mice livers after DEN or without DEN injection. (A) WB analysis shows the expression of pSTAT3, pERK1/2, pGSK-3α/β, and p-c-JUN are upregulated in DEN-induced HCC tumors in Ghr+/+ mice compared with normal liver tissues from control Ghr+/+ mice not treated with DEN or from Ghr−/− mice treated or not treated with DEN. Some of the HCC tumors also show higher levels of pIGF-IR. Notably, there was a slight increase in pERK1/2, pGSK-3α/β, and pIGF-IR in some of the noncancerous livers from Ghr+/+ mice not treated with DEN; nonetheless, these proteins revealed remarkably higher levels in DEN-induced HCC. Despite the lack of HCC development, the expression of pERK1/2 increased in Ghr−/− livers after treatment with DEN. It is possible that this increase resulted from toxic effects of DEN. However, the expression of pERK1/2 was much higher in HCC from Ghr+/+ mice than in the livers from Ghr−/− mice when both groups were treated with DEN. Compared with control livers from Ghr+/+ mice not treated with DEN, HCC tumors from Ghr+/+ mice treated with DEN demonstrated upregulation of BCL-2 and BCL-xL, and downregulation of BCL-xS, which is consistent with apoptosis resistance. In contrast, expression of BCL-2 was downregulated and BCL-xS was upregulated in livers from the Ghr−/− mice that were treated or not treated with DEN. Furthermore, BCL-xL was mostly downregulated in the livers from these mice. (B) Hypothetical diagram, based on the WB results shown in (A), illustrating how GHR signaling promotes apoptosis resistance and cell survival in DEN-induced HCC (induces activation/upregulation:![]()
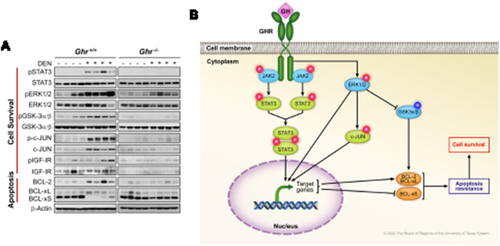
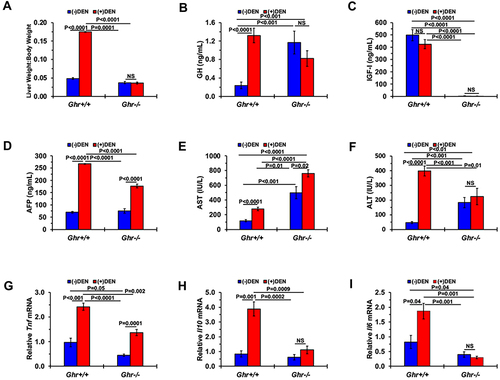
Figure 5 Effects of DEN injection on the liver and circulating cytokines from Ghr+/+ and Ghr−/− mice. (A) Liver weight-to-body weight ratios of 40-week-old Ghr+/+ (n=8) and Ghr−/− (n=7) mice with or without DEN treatment. Serum levels of the following biomarkers are presented including (B) GH (n=5 in each group), (C) IGF-I (n=7 in each group), (D) AFP (n=5 in each group without DEN; n=6 in each group with DEN). (E) AST (n=9 in Ghr+/+; n=7 in Ghr−/−). (F) ALT (n=9 in Ghr+/+; n=7 in Ghr−/−). Relative mRNA levels of the following genes are shown including (G) Tnf (n=5 in each group), (H) Il10 (n=4 in Ghr+/+ without DEN; n=5 in other groups), (I) Il-6 (n=3 in Ghr+/+ without DEN; n=4 in other groups). Data are presented as means ± SE.