Figures & data
Table 1 Patient Characteristics at Baseline by IGF-CTP Classes
Table 2 Patient Characteristics at Baseline by IGF-1 Levels
Figure 1 Association of serum insulin-like growth factor-1 (IGF-1) levels with clinicopathological features. Box plots show the associations between serum IGF-1 levels and (A) serum levels of albumin (ALB), bilirubin, alkaline phosphatase (ALP), alanine transaminase (ALT), and aspartate transaminase (AST); (B) tumor occupancy of ≥50% of liver; (C) high-risk status; (D) portal vein tumor thrombosis (PVTT); and (E) etiology. The upper and lower borders of each box represent maximum and minimum values, respectively, and the line inside each box represents the median of each data set. The points are test values of individual patients. *P < 0.05, **P < 0.01, ***P < 0.001, ****P < 0.0001. High risk was defined as tumor invasion into the main trunk of the portal vein and/or the portal vein branch contralateral to the primarily involved lobe (VP4), and/or bile duct invasion and/or tumor occupancy of ≥50% of liver.
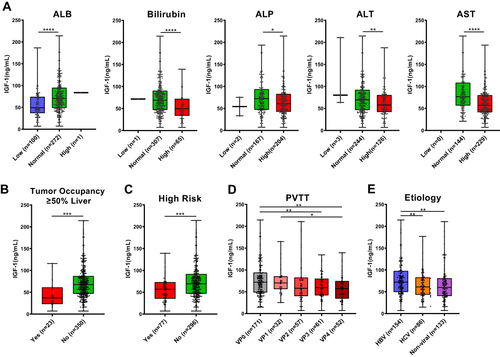
Table 3 Summary of Survival Models for IGF-1 and IGF-CTP Biomarkers
Figure 2 Prognostic and predictive effects of baseline IGF Child-Turcotte-Pugh (CTP) score. The prognostic effects of IGF-CTP scores are shown with Kaplan-Meier (KM) curves of OS (A) and PFS (B) stratified by IGF-CTP A vs B/C for patients within the atezolizumab-bevacizumab (Atezo+Bev) or sorafenib treatment arms. The predictive effect of IGF-CTP scores on Atezo+Bev benefit over sorafenib is shown with KM curves of OS (C) and PFS (D) stratified by treatment arms among patients with IGF-CTP A scores or with B/C scores. The HRs (95% CIs) and P values shown in each graph are adjusted for known prognostic factors described in the Patients and Methods section. NE, not established.
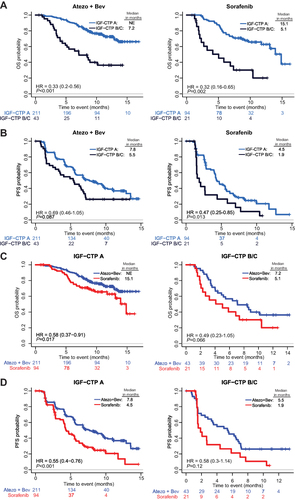
Figure 3 Prognostic and predictive effects of baseline IGF levels (Point 1 vs Point 2/3). The prognostic effects of IGF-1 levels are shown with KM curves of OS (A) and PFS (B) stratified by IGF-1 Point 1 vs Point 2/3 for patients within the Atezo+Bev or sorafenib arms. The predictive effect of IGF-1 levels on Atezo+Bev benefit over sorafenib is shown with KM curves of OS (C) and PFS (D) stratified by treatment arms within patients with Point 1 or with Point 2/3 IGF-1 levels. The HRs (95% CIs) and P values shown in each graph are adjusted for known prognostic factors described in the Patients and Methods section. NE, not established.
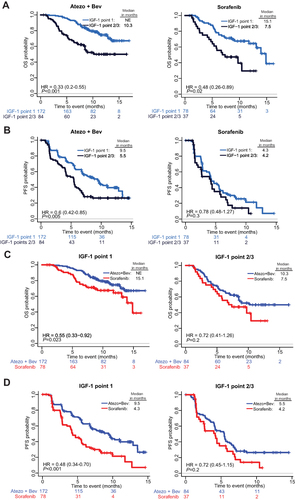
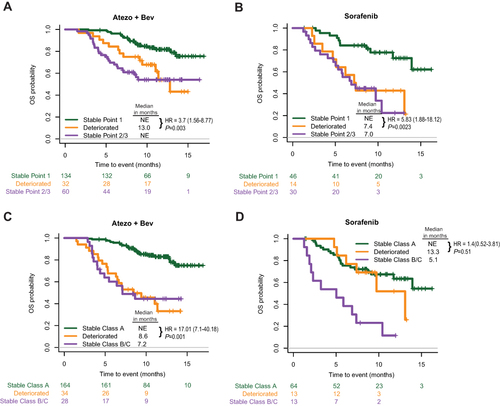
Figure 4 Association of kinetics of IGF-1 levels or IGF-CTP scores with survival outcomes. KM curves of OS stratified after 1 cycle of Atezo+Bev (A) or sorafenib (B) treatment IGF-1 levels stayed at Point 1 (Stable Point 1), decreased from Point 1 to Point 2/3 (Deteriorated) or stayed at Point 2/3 (Stable Point 2/3). KM curves of OS stratified after 1 cycle of Atezo+Bev (C) or sorafenib (D) treatment IGF-CTP classes stayed at A (Stable A), changed to B/C (Deteriorated) or stayed at B/C (Stable Class B/C).