Figures & data
Table 1 Baseline Demographics and Clinical Variables Based on BCLC Status
Table 2 Baseline Demographics and Clinical Variables Based on Milan Criteria, Up-to-7 Criteria and Dispersion of Tumour
Figure 1 CONSORT diagram.Citation28
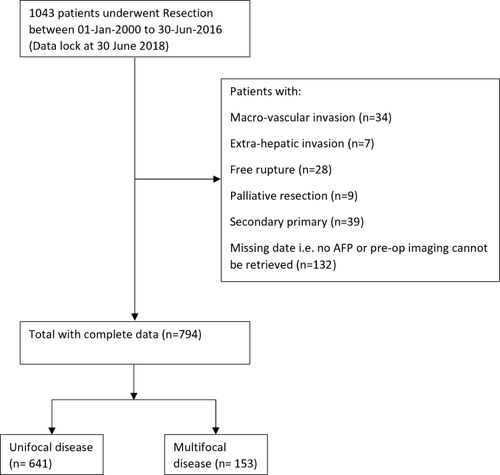
Table 3 Summary of Overall Survival Analysis results
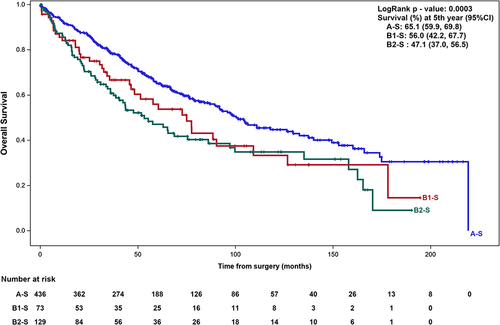
Figure 2 Kaplan Meier curves depicting overall survival analysis of 6 subgroups.
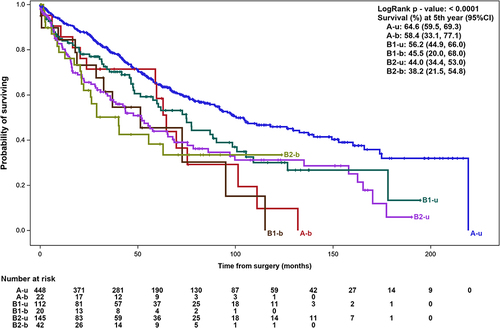
Table 4 Summary of Survival Outcomes of Solitary Lesions Stratified by Size
Figure 3 Kaplan Meier curves depicting overall survival analysis of solitary HCC lesions.