
Figures & data
Table 1 Score Criteria Used for Construction of LFSS
Figure 1 Continued.
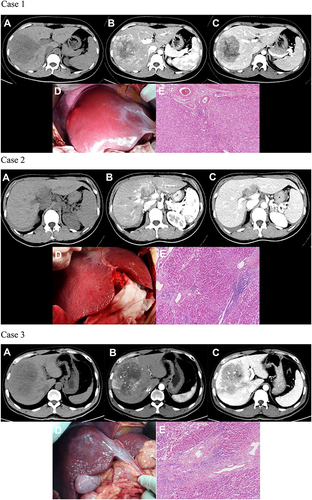
Figure 1 Images to illustrate construction of LFSS. Case 1: A 24-year-old woman with a large right lobe HCC. Preoperative axial multiphasic CT images (A–C) showing typical radiological features of HCC, normal liver morphology, and regular margin. (A) unenhanced CT phase; (B) arterial phase; (C) portal venous phase. Intraoperative photography (D) showed normal liver morphology, absence of regenerative nodules, and ruddy liver parenchyma. According to our LFSS criteria, preoperative radiological evaluation score: 0 (normal morphology), intraoperative observation: 0 (no liver regenerated nodules), liver gross appearance color: ruddy (0), thus total score of LFSS was 0 (None). (E) Histological evaluation of paracancerous parenchyma showed G1 and S1 (HE, 100×). Case 2: A 37-year-old woman with spontaneous rupture of HCC in segment IV. Preoperative axial multiphasic CT images (A–C) showing hypertrophy of the lateral segments of the left liver lobe and regular hepatic margins. (A) unenhanced phase; (B) arterial phase; (C) portal venous phase. Notes: Filling defect caused by tumoral thrombosis was noted in the sagittal part of left portal vein. Intraoperative photography (D) showed multiple micro-regenerative nodules and red liver parenchyma. According to our LFSS criteria, preoperative radiological evaluation score: 1 (morphological change), intraoperative observation: 1 (multiple regenerative micronodules), liver gross appearance color: red (0), thus total score of LFSS was 2 (Mild). (E) Histologic evaluation of paracancerous parenchyma showed G3 and S2 (HE, 100×). Case 3: A 47-year-old man with HCC in the segment VIII. Preoperative axial multiphasic CT images (a-c) were obtained showing liver morphologic change (atrophy of the posterior segments of the right liver lobe) and regular margin. (A) unenhanced phase; (B) arterial phase; (C) portal venous phase. Notes: Anterior branch of right portal vein and distal branch of middle hepatic vein invaded by tumor. Intraoperative photography (D) showed multiple regenerative micronodules and greyish-red liver parenchyma. According to our LFSS criteria, preoperative radiological evaluation score: 1 (morphological change), intraoperative observation: 1 (multiple regenerative micronodules), liver gross appearance color: greyish-red (1), thus total score of LFSS was 3 (Moderate). (E) Histologic evaluation of paracancerous parenchyma showed G3 and S3 (HE, 100×). Case 4: A 57-year-old man with HCC in segment VIII. Preoperative axial multiphasic MR images (A–C) showing liver morphologic changes (atrophy of the posterior segments of the right lobe and medial segments of the left lobe, hypertrophy of the lateral segments of the left lobe) and irregular hepatic margins. (A) precontrast phase; (B) hepatic arterial phase. Notes: Enhancement of portal vein branches but not of hepatic vein branches in hepatic arterial phase; (C) portal venous phase. Notes: Middle and right hepatic veins were compressed by tumor. Intraoperative photography (D) showed multiple regenerative nodules and red liver parenchyma. According to our LFSS criteria, preoperative radiological evaluation score: 1 (morphologic change), intraoperative observation: 2 (multiple regenerative macronodules), liver gross appearance color: red (0), thus total score of LFSS was 3 (Moderate). (E) Histologic evaluation of paracancerous parenchyma showed G3 and S4 (HE, 100×). Case 5: A 61-year-old man with HCC in segment VII. Preoperative axial multiphasic CT images (A–C) showing pronounced liver morphologic changes and irregular margins. (A) unenhanced phase; (B) arterial phase; (C) portal venous phase image; (D) coronal view shows signs of clinically significant PH (engorged and tortuous paraesophageal varices and splenomegaly). Intraoperative photography (E) showed uneven distribution of multiple regenerative micro- and macronodules and greyish-red liver parenchyma. According to our LFSS criteria, preoperative radiological evaluation score: 2 (confirmed liver cirrhosis and/or imaging features of PH), intraoperative observation: 2 (multiple macro-regenerative nodules), liver gross appearance color: 1 (greyish-red), thus total LFSS score was 5 (Severe). (F) Histologic evaluation of paracancerous parenchyma showed G4 and S4 (HE, 100×). Case 6: A 48-year-old man with HCC of the right lobe. Preoperative axial multiphasic CT images (A–C) showing pronounced liver morphologic changes, ascites and splenomegaly. (A) unenhanced phase; (B) arterial phase; (C) portal venous phase. Notes: Neither the right hepatic nor the right portal veins were visualized; (D) coronal image shows compression of the retrohepatic inferior vena cava by tumor and splenomegaly. Notes: This patient received a preoperative diagnosis of intrahepatic cholangiocarcinoma with concomitant PH and cirrhosis. However, postoperative pathology confirmed a diagnosis of HCC. Intraoperative photography (E) showed morphologic changes, no regenerative nodules, and ruddy liver parenchyma. According to our LFSS criteria, preoperative radiological evaluation score: 2 (confirmed cirrhosis and/or imaging features of PH), intraoperative observation: 0 (no regenerative nodules), liver gross appearance color: red (0), thus total LFSS score was 2, (Moderate, in contrast to preoperative assessment as Severe with indicator of PH). (F) Histologic evaluation of paracancerous parenchyma showed G1 and S0 (HE, 100×).
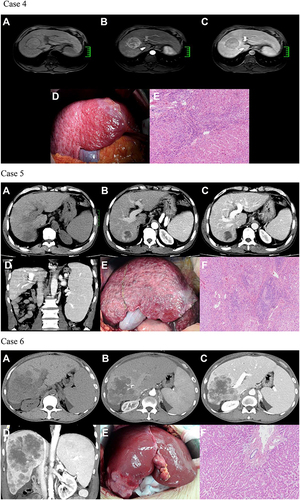
Table 2 Demographic and Clinicopathological Characteristics of the Derivation and External Validation Cohorts
Table 3 Univariate Ordinal Logistic Regression for Liver Fibrosis Stage in the Derivation Cohort
Table 4 Multivariate Ordinal Logistic Regression for Liver Fibrosis Stage in the Derivation Cohort
Figure 2 Continued.
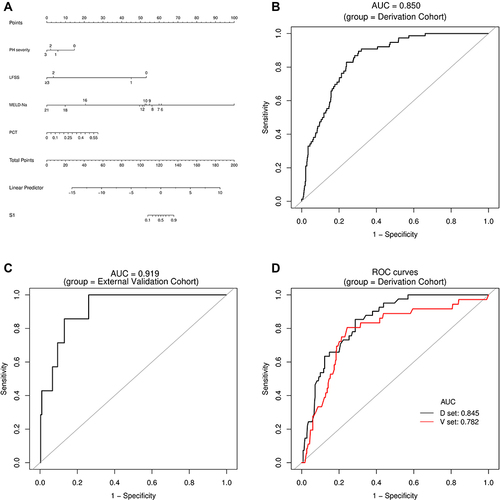
Figure 2 Establishment and validation of S1 predictive nomogram. (A) A predictive nomogram for S1. (B and C) The AUROCs of the nomogram to predict S1 in the Derivation (B) and External Validation (C) cohorts. AUCs are shown in the figure and reported with 95% CIs in the text together with the c-index. (D) Bootstrap analysis for internal validation in the Derivation Cohort. (E) GiViTI calibration plot shows good consistency between the observed frequency and predicted probability for S1 in the Derivation Cohort. Calibration plots (black lines) show fitted polynomial logistic function curves of the relationship between the logit transformation of the predicted probabilities and empirical outcomes (shaded yellow, 95% CI). Ideal reference lines are red. HL chi-square test value is reported in the Results section. (F) Bootstrap analysis for internal validation performed with the External Validation Cohort data. (G) The favorable calibration of the nomogram in the External Validation Cohort was further confirmed by the GiViTI calibration plot. HL chi-square test value is reported in the Results section.
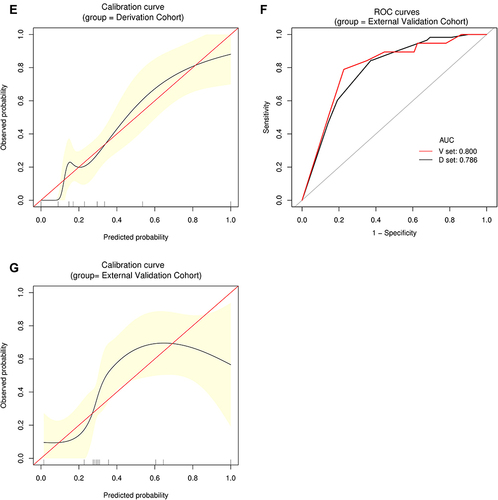
Figure 3 Continued.
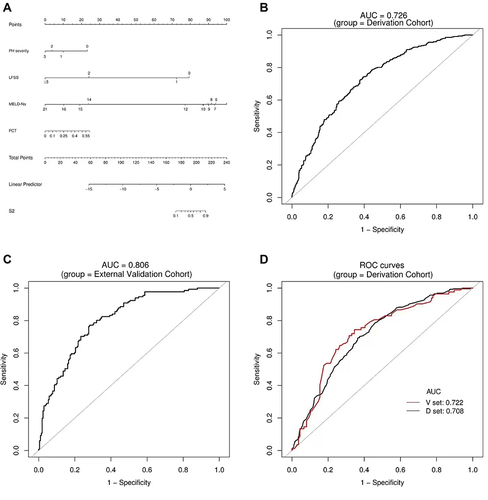
Figure 3 Establishment and validation of S2 predictive nomogram. (A) A predictive nomogram for S2. (B and C) The AUROCs of the nomogram to predict S2 in the Derivation (B) and External Validation (C) cohorts. AUCs are shown in the figure and reported with 95% CIs in the text together with the c-index. (D) Bootstrap analysis for internal validation in the Derivation Cohort. (E) A GiViTI calibration plot showed good consistency between the observed frequency and predicted probability for S2 in the Derivation Cohort. Calibration plots are as defined in the legend. HL chi-square test value is reported in the Results section. (F) Bootstrap analysis for internal validation performed with the External Validation Cohort data. (G) The favorable calibration of the nomogram in the External Validation Cohort was further confirmed by the GiViTI calibration plot. HL chi-square test value is reported in the Results section.
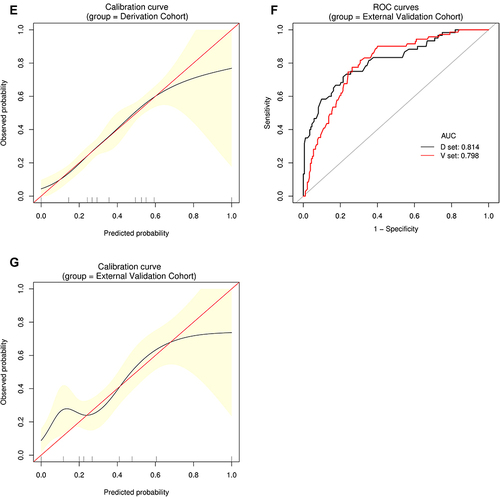
Figure 4 Continued.
Figure 4 Establishment and validation of S3 predictive nomogram. (A) A predictive nomogram for S3. (B and C) AUROCs to predict S3 in the Derivation (B) and External Validation (C) cohorts. (D) Bootstrap analysis for internal validation in the Derivation Cohort. (E) GiViTI calibration plot showed good consistency between the observed frequency and predicted probability for S3 in the Derivation Cohort. Calibration plots are as defined in the legend. HL chi-square test value is reported in the Results section. (F) Bootstrap analysis for internal validation performed with the External Validation Cohort data. (G) The favorable calibration of the nomogram in the External Validation Cohort was further confirmed by the GiViTI calibration plot. HL chi-square test value is reported in the Results section.
Figure 5 Continued.
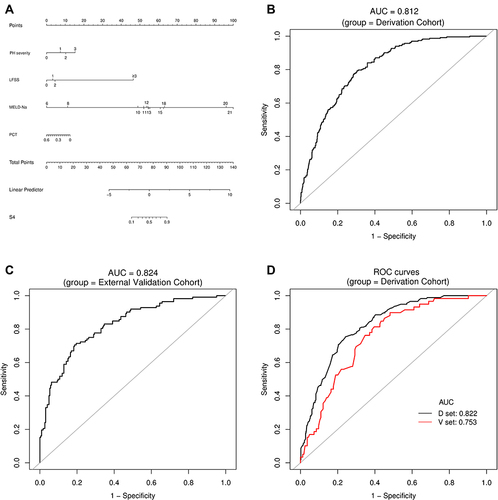
Figure 5 Establishment and validation of S4 predictive nomogram. (A) Predictive nomogram for S4. (B and C) AUROCs to predict S4 in the Derivation (B) and External Validation (C) cohorts. (D) Bootstrap analysis for internal validation in the Derivation Cohort. (E) GiViTI calibration plot showed good consistency between the observed frequency and predicted probability for S4 in the Derivation Cohort. Calibration plots are as defined in the legend. HL chi-square test value is reported in the Results section. (F) Bootstrap analysis for internal validation performed with the External Validation Cohort data. (G) The favorable calibration of the nomogram in the External Validation Cohort was further confirmed by the GiViTI calibration plot. HL chi-square test value is reported in the Results section.
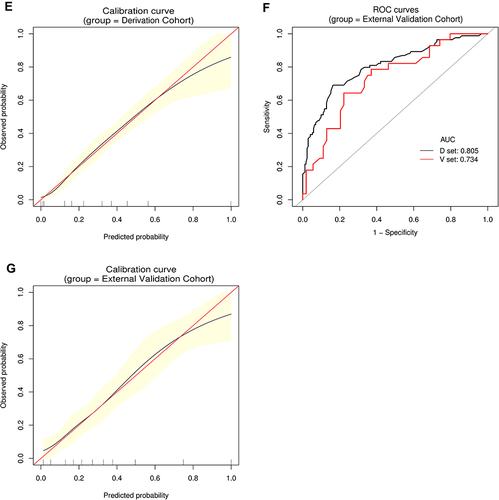
Figure 6 Continued.
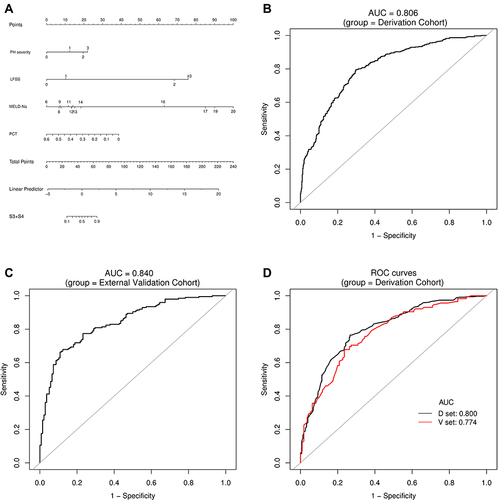
Figure 6 Establishment and validation of S3+S4 predictive nomogram. (A) Predictive nomogram for S3+S4. (B and C) AUROCs to predict S3+S4 in the Derivation (B) and External Validation (C) cohorts. (D) Bootstrap analysis for internal validation in the Derivation Cohort. (E) GiViTI calibration plot showed good consistency between the observed frequency and predicted probability of S3+S4 in the Derivation Cohort. Calibration plots are as defined in the legend. HL chi-square test value is reported in the Results section. (F) Bootstrap analysis for internal validation performed with the External Validation Cohort data. (G) The favorable calibration of the nomogram in the External Validation Cohort was further confirmed by the GiViTI calibration plot. HL chi-square test value is reported in the Results section. The calibration curves for S1, S2, S3, S4 and S3+S4 were ideal-matched with a 45° reference line, indicating optimal agreement between the nomogram-predicted probabilities on the X-axis, and the actual rates on the Y-axis. HL chi-square calibration values for each cohort are reported in the Results section.
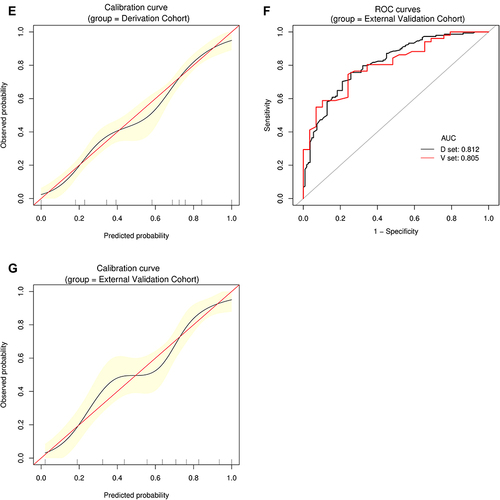
Table 5 ROC Curve Analysis of Selective NITs, LFSS and PH Severity for Different Liver Fibrosis Stage
Figure 7 Continued.
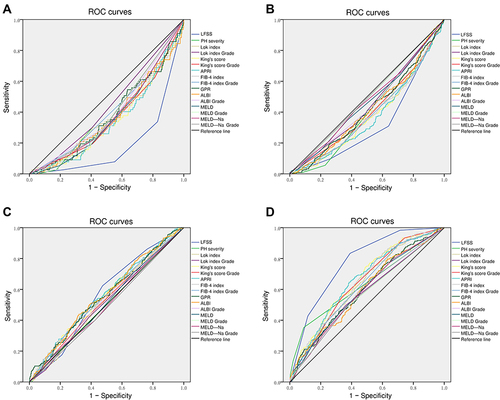
Figure 7 ROC analysis of selective serum indices, LFSS, and PH severity. (A) S1 diagnosis; (B) S2 diagnosis; (C) S3 diagnosis; (D) S4 diagnosis; (E) S1+S2 diagnosis; (F) S2+S3 diagnosis; (G) S3+S4 diagnosis. Results are shown in detail in .
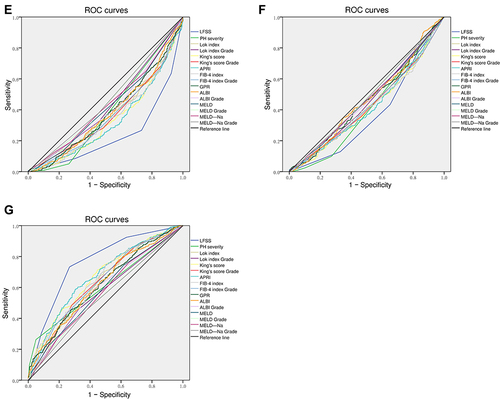
Table 6 Summary of Inflammation Grade Across Different Liver Fibrosis Stage Groups in the Derivation Cohort
Table 7 Correlation Between Fibrosis Stage and Inflammatory Grade in the Derivation Cohort