
Figures & data
Table 1 Patients Characteristics
Figure 1 Flowchart of patient inclusion and exclusion.
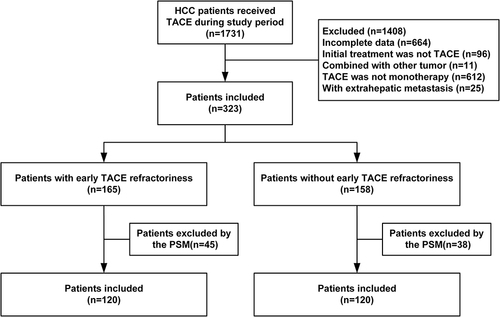
Figure 2 Kaplan-Meier survival curves of HCC patients with and without early TACE-refractoriness before and after PSM. (A) Before PSM, Median OS of patients with and without early TACE refractoriness was 21 m (95% CI: 17.3–24.7) and 39 m (95% CI: 29.2–48.8), respectively (p = 0.000). (B) After PSM, median OS of patients with and without early TACE refractoriness was 21 m (95% CI: 15.7–26.3) and 34 m (95% CI: 27.5–40.5), respectively (p = 0.002).
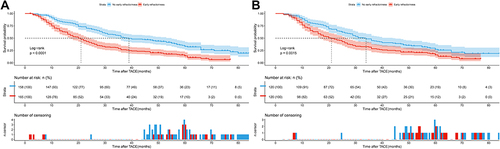
Figure 3 Overall survival of HCC patients with and without early TACE refractoriness in different BCLC stages [(A): Stage A, 28 m, (95% CI: 22.0–34.0); 57 m, (95% CI: 51.3–62.7), p = 0.000. (B): Stage B, 20 m, (95% CI: 16.1–23.9); 36 m, (95% CI: 29.2–42.8), p = 0.002. (C): Stage C, 14 m, (95% CI: 6.1–21.9); 25 m, (95% CI: 19.3–30.7), p = 0.398].
![Figure 3 Overall survival of HCC patients with and without early TACE refractoriness in different BCLC stages [(A): Stage A, 28 m, (95% CI: 22.0–34.0); 57 m, (95% CI: 51.3–62.7), p = 0.000. (B): Stage B, 20 m, (95% CI: 16.1–23.9); 36 m, (95% CI: 29.2–42.8), p = 0.002. (C): Stage C, 14 m, (95% CI: 6.1–21.9); 25 m, (95% CI: 19.3–30.7), p = 0.398].](/cms/asset/0f1177bb-d148-46f4-a66b-d20a43a74df0/djhc_a_12151530_f0003_c.jpg)
Table 2 Patients Characteristics After PSM (TACE-Non-Refractoriness and TACE-Refractoriness*)
Figure 4 The median OS was 35 m (95% CI: 21.6–48.5) in the early TACE-refractory group (viable lesions > 50%) and 31 m (95% CI: 25.4–36.6) in the nonrefractory group after PSM (p = 0.611).
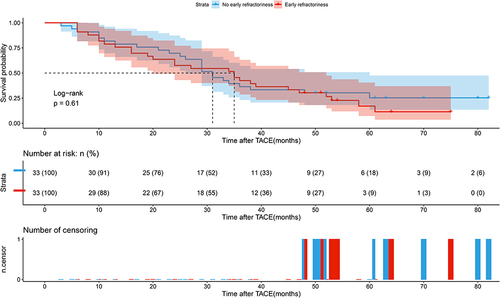
Table 3 Predictors of Death for HCC Patients Treated by TACE