Figures & data
Table 1 Correlation Between circRASSF5 Expression and HCC Clinicopathologic Features in 172 Patients
Figure 1 Dysregulated RASSF5-derived circRASSF5 in HCC. (A) The scheme illustrating the production of circRASSF5. CircRASSF5 derived from back-splicing of exons 2–5 of RASSF5 gene and the mature sequence of circRASSF5 is 647 bp. (B) qRT-PCR results of the level of circRASSF5 in HCC tissues and adjacent non-tumorous liver tissues. (C) qRT-PCR results of the expression of circRASSF5 in HCC cell lines (HepG2, Huh7, SMMC-772, MHCC-97H and Hep3B) and normal liver cell line (L02). (D) FISH assay was applied to explore the subcellular location of circRASSF5 in Hep3B cell (original magnification ×400). Green represents circRASSF5 and blue represents cell nucleus. (E and F) The overall survival (OS) and recurrence-free survival (RFS) rates of 172 HCC patients were analyzed by Kaplan–Meier and Log rank test analyses between low circRASSF5 expression group and high circRASSF5 expression group. **P < 0.01; ***P < 0.001.
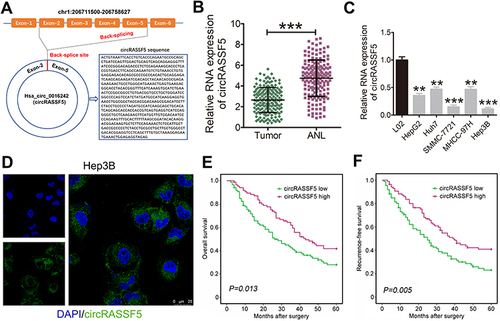
Figure 2 CircRASSF5 suppresses the proliferation, migration and invasion capacities of HCC cells in vitro. (A) The proliferation ability of HCC cells was evaluated by CCK-8 assay when circRASSF5 was stably overexpressed or knockdown. (B) Proliferation capacity of HCC cells was detected by means of EdU staining assay when circRASSF5 was overexpressed or knocked down (original magnification ×100). (C) Wound healing assay was used to assess the migration ability of Hep3B and SMMC-7721 cells after transfected with Ov-circRASSF5 or mock vectors; MHCC-97H and Huh7 cells after transfected with sh-cricRASSF5 or sh-NC vectors (original magnification ×50). (D) The invasion ability of Hep3B and SMMC-7721 cells transfected with Ov-circRASSF5 or mock vectors, MHCC-97H and Huh7 cells transfected sh-circRASSF5 or sh-NC vectors were detected via transwell assays (original magnification ×100). Our study performed each experiment in triplicate and exhibited the results as the mean ± SD. *P < 0.05; ***P < 0.001.
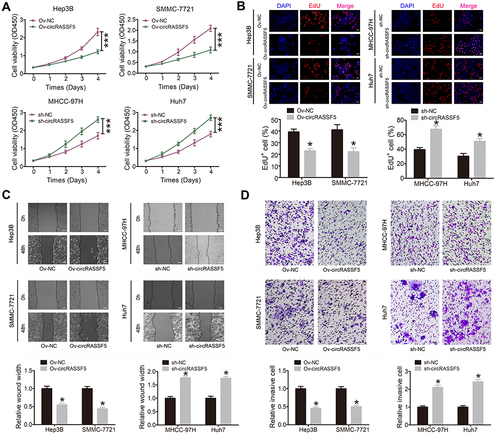
Figure 3 CircRASSF5 directly binds to miR-331-3p and restrains miR-331-3p activity. (A) RNA pull-down assay was carried out in Hep3B, SMMC-7721, MHCC-97H and Huh7 cells, and the pull-down efficiency of circRASSF5 probe was verified by qRT-PCR assay. (B) The relative expression of 6 potential target miRNAs pull-down by circRASSF5 probe were detected in Hep3B, SMMC-7721, MHCC-97H and Huh7 cells. (C) The results of luciferase reporter assay in HEK293T cells after co-transfected with miR-331-3p mimics, circRASSF5 WT or circRASSF5 Mut plasmids. (D) Relative levels of circRASSF5 in Hep3B and SMMC-7721 lysates captured by biotinylated wild-type miR-331-3p (Biotin-miR-331-3p-WT) or mutant miR-331-3p (Biotin-miR-331-3p-Mut). (E) FISH assay was conducted to investigate the subcellular of circRASSF5 and miR-331-3p in Hep3B cells (original magnification ×400). Nuclei were stained with DAPI. CircRASSF5 was labeled with Cy3 and miR-331-3p was labeled with Cy5. (F) The relative miR-331-3p level was investigated by qRT-PCR in HCC cells when circRASSF5 was overexpressed or knockdown. (G) QRT-PCR was applied to investigate the levels of circRASSF5 in Hep3B and SMMC-7721 cells when miR-331-3p was overexpressed or knockdown. Our study performed each experiment in triplicate and exhibited the results as the mean ± SD. *P < 0.05; **P < 0.01.
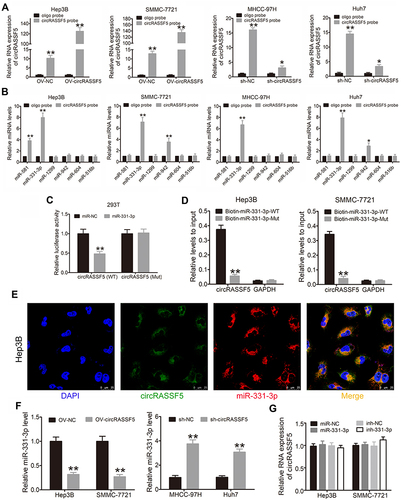
Figure 4 miR-331-3p exerts tumor-promoting effect in HCC cells by targeting PHLPP. (A) Schematic of PHLPP 3’ UTR WT and Mut luciferase reporter vectors. (B) The results of luciferase reporter assay in HEK293T cells after co-transfected with miR-331-3p mimics, PHLPP 3’ UTR WT or Mut plasmids. (C) Western blot assay was conducted to investigate the expression of PHLPP1 and PHLPP2 in Hep3B and SMMC-7721 cells after transfected with miR-331-3p mimics or control vector. The fold change comparing to miR-NC normalized by GAPDH was listed beneath each band. (D) The proliferation ability of HCC cells was assessed by CCK-8 assay when miR-331-3p was stably overexpressed. (E) Proliferation capability of HCC cells was detected through EdU staining assay when miR-331-3p was overexpressed (original magnification ×100). (F) Wound healing assay was used to investigate cell migration ability in Hep3B and SMMC-7721 cells after transfected with miR-331-3p mimics or mock vectors (original magnification ×50). (G) The invasion ability of Hep3B and SMMC-7721 cells transfected with miR-331-3p mimics or mock vectors was detected via transwell assays (original magnification ×100). Our study performed each experiment in triplicate and exhibited the results as the mean ± SD. *P < 0.05; **P < 0.01; ***P < 0.001.
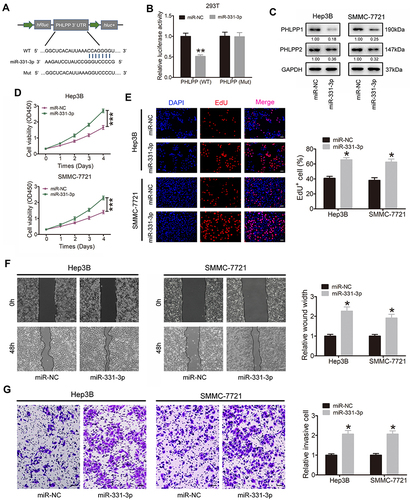
Figure 5 CircRASSF5 exerts its tumor-suppressing function through sponging with miR-331-3p and then strengthening PHLPP expression in HCC cells. (A) HEK293T cells were co-transfected with circRASSF5 vector or Mock, miR-331-3p mimics or miR-NC and luciferase reporter vector PHLPP 3’ UTR-WT or PHLPP 3’ UTR-Mut. And then we detected the relative luciferase activities of each group. (B) Western blot assay was applied to evaluate the protein levels of PHLPP1 and PHLPP2 in Hep3B and SMMC-7721 cells which were co-transfected with Ov-circRASSF5 or mock vector and miR-331-3p mimics or miR-NC. The fold change comparing to Ov-NC normalized by GAPDH was listed beneath each band. (C) The proliferation ability of HCC cells was detected by CCK-8 assay after co-transfected with Ov-circRASSF5 and miR-331-3p mimics. (D and E) The migration and invasion abilities of HCC cells were evaluated by wound healing and transwell Matrigel invasion assays after co-transfection of Ov-circRASSF5 and miR-331-3p mimics. Our study performed each experiment in triplicate and exhibited the results as the mean ± SD. *P < 0.05.
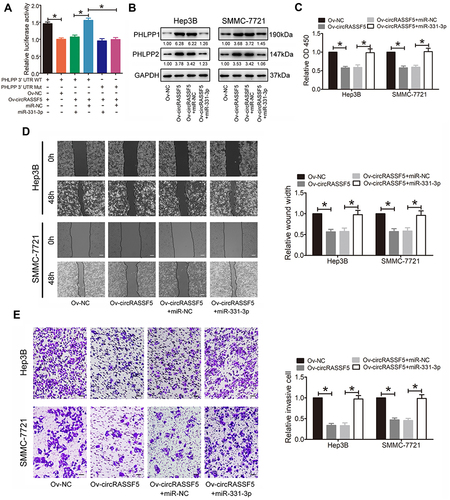
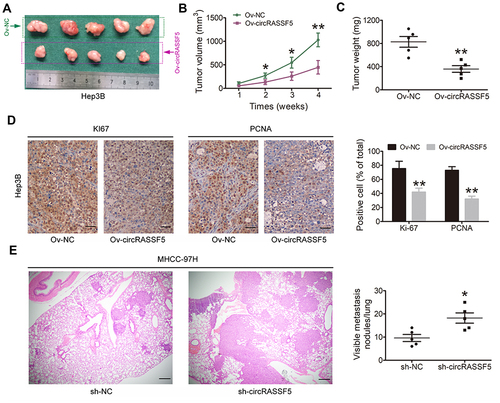
Figure 6 CircRASSF5 inhibits the growth and metastasis of HCC in vivo. (A) We applied BALB/c nude mice to construct the subcutaneous xenograft model by subcutaneously injected with circRASSF5 overexpression Hep3B cells and the control cells when mice were 6-week-old (5 mice in each group). Four weeks later, mice were sacrificed and the tumor size was measured. (B) We measured the tumor volumes once a week, and the growth curves of them in each group were analyzed and presented. (C) The relative weight of each tumor was calculated and analyzed between two groups. (D) Immunohistochemistry (IHC) assay was conducted to evaluate the ratio of Ki-67 and PCNA positive cells in the tumor tissues of subcutaneous xenografts (original magnification ×100). (E) A lung metastasis model was established by injecting MHCC-97H cells into mice through tail vein. And then the lung colonization was evaluated by the histological examination (H&E) (original magnification ×100). The results are shown as the mean ± SD. *P < 0.05; **P < 0.01.