Figures & data
Table 1 Patient and Tumor Characteristics
Table 2 Prognostic Factors for Local Control
Table 3 Projected 2-Year Local Control Rates for Common Stereotactic Body Radiation Therapy (SBRT) Schedules and Selected Tumor Diameters, Based on Etiology of Hepatocellular Carcinoma
Figure 1 Kaplan–Meier curves for local tumor control following SBRT stratified by (A) tumor diameter, (B) biologically effective dose (BED), and (C) etiology.
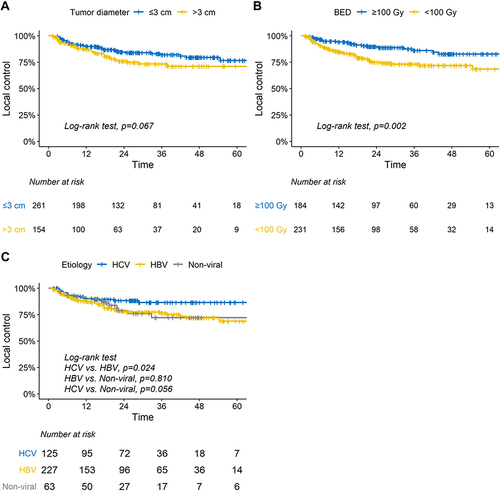
Figure 2 Tumor control probability modelling results for actuarial 2-year local control with size-adjusted biologically effective dose (sBED) for patients with hepatitis C virus (Black) and hepatitis B or non-viral etiology (grey).
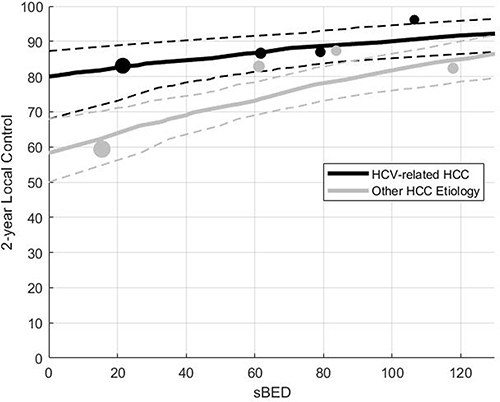
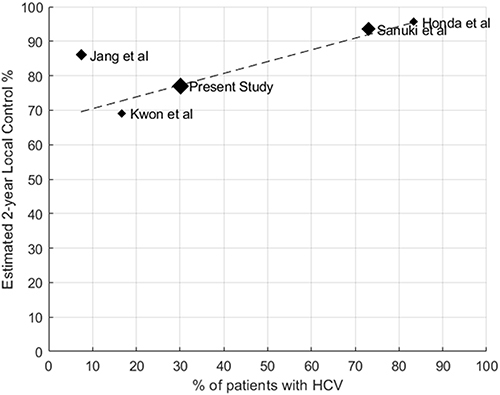
Figure 3 Scatter plot of 2-year actuarial local control rate versus percentage of patients with hepatitis C in studies included in the HyTEC analysis as well as in the present study. Marker sizes are proportional to study sample sizes. The dotted line depicts the results of weighted linear regression, excluding the present study.