Figures & data
Figure 1 The flow chart showing the scheme of our study for hepatocellular carcinoma.
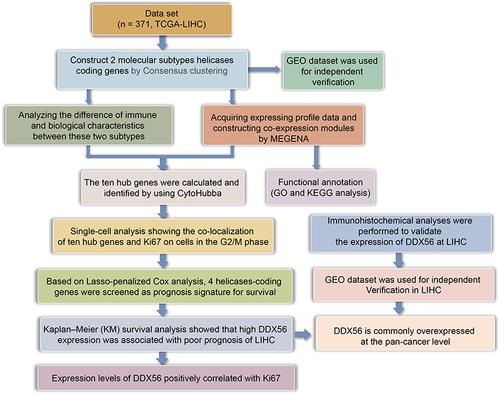
Figure 2 Expression variation of helicase molecules. (A) The waterfall diagram shows the somatic mutations of the 10 helicases with the highest mutation frequency in pan-cancer. Here, 44.29% is the proportion of 2125 samples with at least one mutation of the top 10 genes among 4798 samples with at least one mutation of 112 helicases. The percentage figure of each line on the right of the picture is the number of samples with the corresponding gene mutation divided by 4798 samples with at least one mutation among the 112 helicases. (B) The bubble chart shows the correlation between CNV of the 112 helicases and mRNA expression level. Red indicates positive correlation; blue indicates negative correlation. The deeper color indicates a larger correlation index. The bubble size indicates the FDR. (C) The bubble chart shows the correlation between methylation of the 112 helicases and mRNA expression. Red shows a positive correlation and blue shows a negative correlation. The darker color indicates a larger correlation index. Bubble size indicates the FDR. (D) Mutation characteristics of the 112 helicases in 374 patients with bladder cancer in the TCGA-LIHC cohort; green indicates co-mutation, the asterisk indicates P-value (P < 0.05, *P < 0.1). (E) Mutation frequency of 112 helicases in 374 patients in the TCGA-LIHC cohort. Each column represents an individual patient. The small figure above shows the TMB, the number on the right shows the mutation frequency of each regulator, and the figure on the right shows the proportion of each variant.
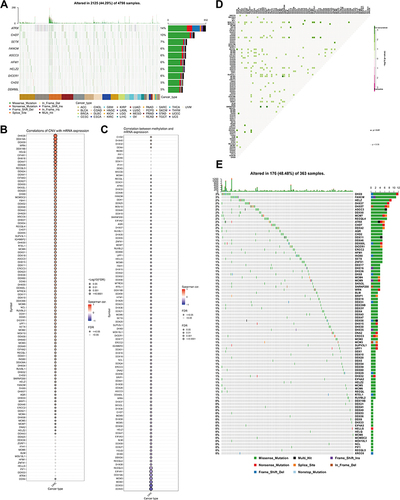
Figure 3 (A) Heatmap depicts consensus clustering solution (k = 2) for 112 helicases in 374 LIHC samples; (B) Delta area curve of consensus clustering indicates the relative change in area under the cumulative distribution function (CDF) curve for k = 2–6. (C) The consensus score matrix of all samples when k = 2–6. (D) The PCA distribution of TCGA-LIHC cases by expression profile of helicases. Each point represents a single sample; different colors and shapes represent the C1 and C2 subtypes, respectively. (E) Heatmap of 112 helicases expressions in different subtypes. Red represents high expression and blue represents low expression. (F–H) Kaplan–Meier curves of OS (F), DSS (G), DFS (H) in C1 and C2 (TCGA-LIHC, n = 374). Log rank test was performed. (I) Relationship between two subtypes and the clinicopathological parameters, including gender, T, N, and M stage, pathological stage, and tumor grade (TCGA-LIHC, n = 374, *P < 0.05). (J) Oncoplot displaying mutation profile of a union set of the top 20 genes with highest mutation frequency in C1 and C2, respectively. (K and L) Graphs showing mutually exclusive and co-occurrence of mutational events in C1(K) and C2 (L), respectively (·P < 0.05, *P < 0.1). (M) Differential TIDE score between C1 and C2 (TCGA-LIHC, n = 374, **P < 0.1). Wilcoxon test was performed.
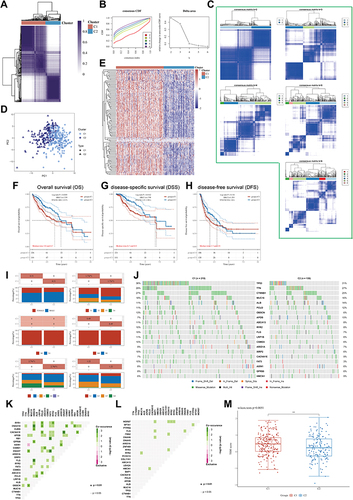
Figure 4 Function analysis of helicase phenomenon. (A) Volcano map of differentially expressed genes between C1 and C2. Red indicates up-regulated genes in C1, blue indicates down-regulation. Data on the abscissa are differences in gene expression (log2 fold change); data on the ordinate represent the significance of these differences (−log10 padj) (TCGA-LIHC, n = 374). (B) Gene Set Enrichment Analysis (GSEA) of C1 and C2. (C) The DEGs between C1 and C2 in the co-expression network. Each node represents a gene module, with the larger nodes indicating a higher number of genes. (D) The MEGENA network showing the largest gene module. The degree value of the node was calculated by Cytoscape. The higher the degree value, the darker the color the larger the size. (E) GO and KEGG enrichment analysis of the largest gene modules. Each colored bar indicates a different biological process. (F) The correlation between the 10 hub genes in HCC and important cancer signaling pathways. The solid line represents activation and the dashed line represents inhibition. (G) Expression level of 10 hub genes between HCC tissues in the TCGA-LIHC cohort (n = 50) and paired control tissues (TCGA-LIHC, n = 50, ***P < 0.001). (H) Expression level of 10 hub genes between C1 and C2 (TCGA-LIHC, n = 374, ***P < 0.001).
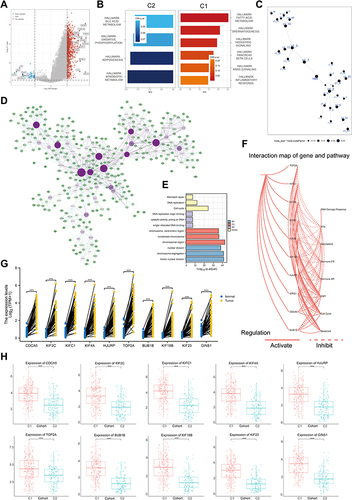
Figure 5 Single cell analysis of hub genes. (A) Heatmap depicting expressions of top 10 marker genes among 14 detected HCC cell clusters. (B) Cells were clustered into 14 types via UMAP and tSNE dimensionality reduction algorithm, each color represents a unique cluster. (C) SingleR was used to automatically annotate each cell, and the bar at the top of the graph represents the cluster and cell label, respectively. (D) The dot plot shows the situation after manual modification, with each color representing the annotated phenotype of each cluster. (E and F) tSNE distribution of all hub genes, including dot plot (E) and violin plot (F). (G) The cell cycle is annotated by marker genes, red for G1 phase, green for G2M phase and blue for S phase. (H) Heat map showing the significant correlation of all hub genes with MKI67. The top half of the graph represents the expression trend of MKI67 and the bottom half represents the expression trend of all hub genes, with blue representing low expression and red representing high expression (TCGA-LIHC, ***P < 0.001).
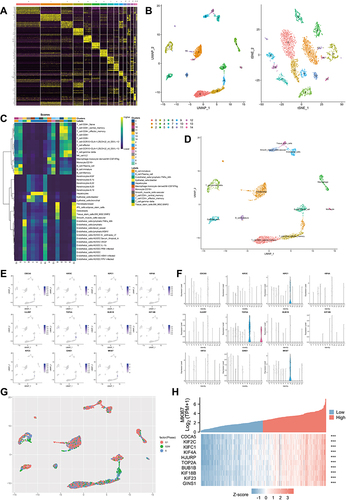
Figure 6 Identification of DDX56 as an independent prognosis factor. (A–C) least absolute shrinkage and selection operator model (LASSO) fitting based on OS (A), DFS (B), PFI (C). Each curve represents a gene. The profiles of coefficients were plotted versus log(λ). Vertical lines indicate the positions of all genes with coefficients greater than 0 determined by 10-fold cross-validation. λ was determined from 10-fold cross-validation. The x-axis represents log(λ); the y-axis represents binomial deviance. Optimal values calculated from minimum criteria and one standard error of the criteria are indicated by the dotted vertical lines. (D–I) Univariate (D–F) forest plot and multivariate (G–I) forest plot showing association between 6 candidate genes expression and OS (D and G), 8 candidate genes and DSS (E and H), 5 candidate genes and PFI (F and I) in HCC. (J–M) OS about DHX58, DSS about DDX43, PFI about DDX56, and DSS about DHX58 based on TCGA-LIHC (TCGA-LIHC, n = 374, Log rank test). (N) The mRNA expression of DDX56 between tumor and normal control tissues in pan-cancer was assessed from TCGA database. (TCGA-LIHC, n = 374; NS: not significant, *P < 0.05, ***P < 0.001).
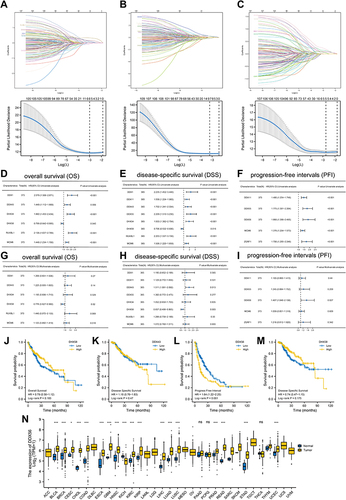
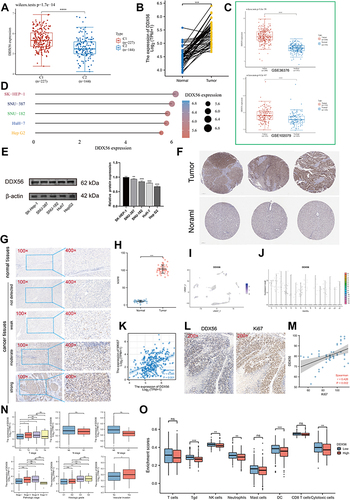
Figure 7 Expression analysis of DDX56 in LIHC. (A) Differential expression of DDX56 between C1 and C2 clusters based on TCGA-LIHC databases (n = 374, ****P < 0.0001). (B) Expression level of DDX56 between the tumor and paired normal tissues in the TCGA-LIHC databases (n = 50, ***P < 0.001). (C) Differential expression of DDX56 between normal tissue and HCC tissue by using public datasets from Gene Expression Omnibus GSE36376 (n = 433, ****P < 0.0001) and GSE102079 (n = 257, ****P < 0.0001). (D and E) DDX56 protein expression in different HCC cell lines (**P < 0.01, ***P < 0.001). (F) Immunohistochemical analysis of DDX56 in HCC tissues and normal tissues based on Human Protein Atlas database (HPA). (G and H) Representative images of different immunohistochemical staining intensities for DDX56 based on our own HCC samples and statistical comparison of DDX56 expression levels (H-SCORE) in HCC tissues and normal tissues (n = 50, ***P < 0.001). (I) UMAP plots showing expression of DDX56 clusters. (J) The cell type assignment of each cluster is based on the DDX56 expression. (K) Correlation of the DDX56 expression levels with MKI67 based on TCGA-LIHC (n = 374). (L and M) Correlation between DDX56 and Ki67 based on immunohistochemical H-score calculation (n = 50). (N) Association of DDX56 mRNA expression with T/N/M stages, pathological stage, histologic grade and vascular invasion in HCC patients based on TCGA-LIHC (n = 374, NS: not significant, *P < 0.05, **P < 0.01, ***P < 0.001). (O) Analysis of differentially immune infiltration level with DDX56 high and low expression in TCGA-LIHC (NS: not significant, *P < 0.05, **P < 0.01, ***P < 0.001).