
Figures & data
Table 1 Dose Rates and Irradiation Time of Tsing Hua 60Co Radiation Field
Table 2 Dose Rates of Tsing Hua Open-Pool Reactor
Table 3 Radiation Dose for Irradiation Time
Figure 1 Radioresistance establishment via intermittent irradiation. (A) Timeline of radioresistant HepG2-R cell establishment. (B) Representative images of the colony formation assay. HepG2 and HepG2-R cells were exposed to 0, 1, 2, 3, 5, and 8 gray (Gy) γ-ray radiation. Colonies were visualized by crystal violet staining. (C) The survival fraction after γ-ray irradiation. The red and blue lines represent HepG2-R and HepG2 cells, respectively. At 1, 2, and 5 Gy, the survival fractions of HepG2-R cells were significantly higher than those of HepG2 cells. (**p < 0.01).
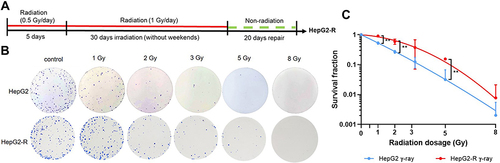
Figure 2 10B (boric acid) uptake in HepG2 and HepG2-R cells. Cells were treated with 25 μg 10B/mL boric acid (BA). The round dots represent HepG2 cells, and the square represents HepG2-R cells. (A) Time course of 10B uptake. Cells were treated with 25 μg 10B/mL BA for 0, 30, 60, 90, and 120 minutes. (B) Quantification analysis of 10B uptake. The 10B concentrations were calculated at 30 minutes after treatment.
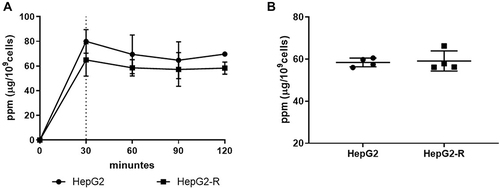
Figure 3 The enhanced anticancer effect of boron neutron capture therapy (BNCT) on radioresistant HepG2-R cells. (A) Representative images of the colony formation assay. HepG2 and HepG2-R cells were exposed to 0, 1, 2, and 3 gray (Gy) BNCT and γ-ray irradiation. (B) The survival fraction after irradiation. The red and blue lines represent HepG2-R and HepG2 cells, respectively. The round dots represent γ-ray irradiation, and the squares represent BNCT. At 1, 2, and 3 Gy, the survival fractions of HepG2 and HepG2-R cells were significantly lower after BNCT than after γ-ray irradiation. (*p<0.05, **p < 0.01, ***p<0.001, ****p<0.0001).
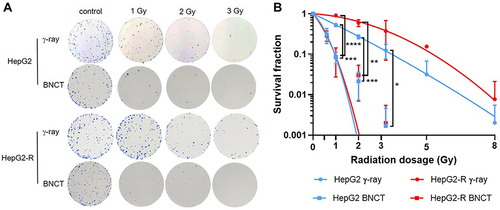
Table 4 The D10 and Relative Biological Effectiveness of HepG2 and HepG2-R
Figure 4 Boron neutron capture therapy increased the number of DNA DSBs and impeded their repair. Representative images of γH2AX foci by immunocytochemistry (ICC) at 2 hours (A) and 24 hours (B) post-irradiation. The green fluorescence represents γH2AX, and the blue fluorescence represents nuclei. The quantitative analysis of ICC is expressed as the fold change of γH2AX fluorescence area/nucleus. The expression level of γH2AX in HepG2 and HepG2-R cells at 2 hours (C), 10 hours (D), and 24 hours (E) post-irradiation. (*p<0.05, **p < 0.01, ***p<0.001, ****p<0.0001).
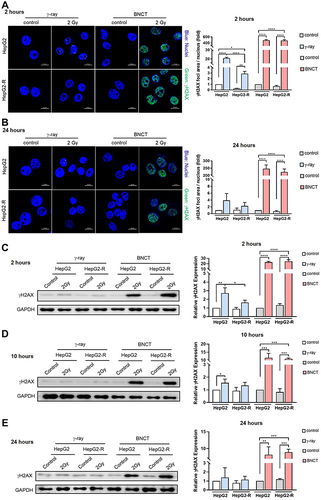
Figure 5 Boron neutron capture therapy resulted in delayed homologous recombination and inhibited the nonhomologous end-joining pathway. Western blot assay for the DNA damage repair-related proteins KU80, KU70, and RAD51 at 2 hours (A), 10 hours (B), and 24 hours (C) post-irradiation. (*p<0.05, **p < 0.01).
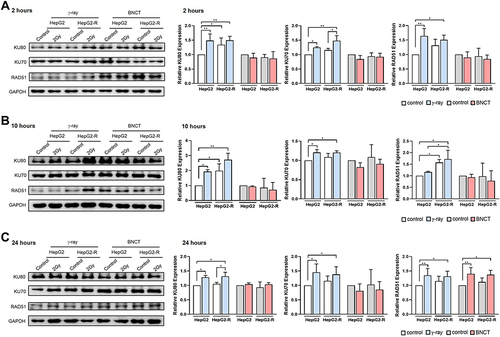
Figure 6 Boron neutron capture therapy significantly increased cell cycle arrest in radioresistant HepG2-R cells. (A) Cell percentages of different cell cycle phases were assessed by a cell cycle assay using 7-amino-actinomycin D (7-AAD) staining. (B) Quantitative analysis of the cell cycle in the G2/M phase. (C) Quantitative analysis of the cell cycle assay for the sub-G1 phase. (*p<0.05, **p < 0.01, ***p<0.001, ****p<0.0001).
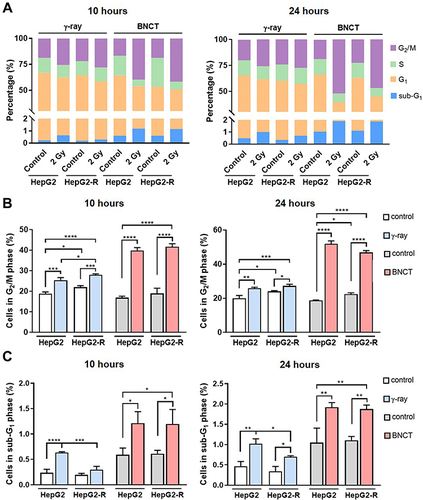
Figure 7 Boron neutron capture therapy increased G2/M arrest by altering CHK2 and CDK1 (CDC2) checkpoint signaling. Western blot assay for the G2/M checkpoint regulation-related proteins pCHK2, CHK2, pCDK1 (CDC2) (Y15), pCDK1 (pCDC2) (T161), and CDK1 (CDC2) at 10 hours (A) and 24 hours (B) post-irradiation. (*p<0.05, **p < 0.01, ***p<0.001).
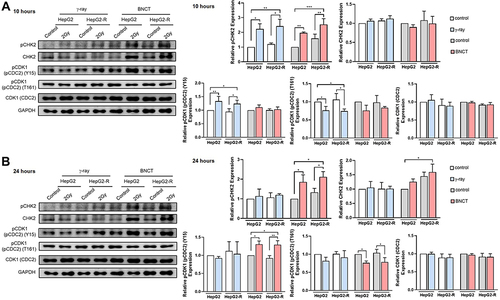
Figure 8 PUMA-mediated apoptosis underlies boron neutron capture therapy’s mechanism of action. Caspase-3 activity histograms of the caspase-3 apoptosis assay were generated after PE staining at 24 hours (A) and 48 hours (B) post-irradiation. The blue line represents the control group, and the red line represents the irradiation group. The quantitative analysis of cell percentages with caspase-3 activity was performed by CytExpert. Western blot assay for apoptosis-related proteins BCL2, PUMA, and BAX at 24 hours (C) and 48 hours (D) post-irradiation. (*p<0.05, **p < 0.01, ***p<0.001, ****p<0.0001).
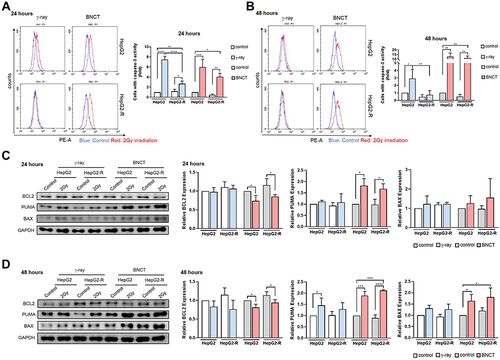
Figure 9 Proposed scheme for boron neutron capture therapy-induced DNA damage responses in HCC.
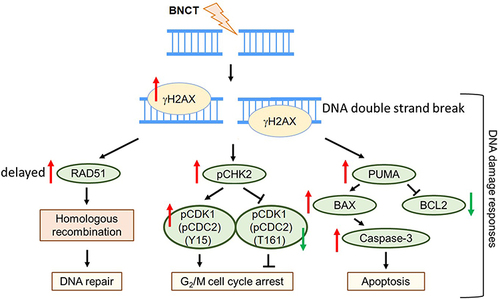
Table 5 The Comparison of the DNA Damage Responses Induced by BNCT and γ-ray