
Figures & data
Figure 1 Flow chart of patient selection criteria.
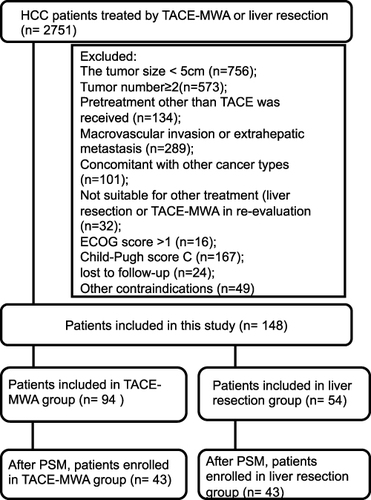
Table 1 The Detailed Characteristics of the Patients Before and After PSM
Figure 2 Overall survival (OS) of patients before or after propensity score matching. (A) There is no significant difference in terms of OS in the TACE-MWA group and liver resection group. (P = 0.93). (B) In the propensity score-matched cohort, TACE-MWA showed comparable efficacy to liver resection (P = 0.3).
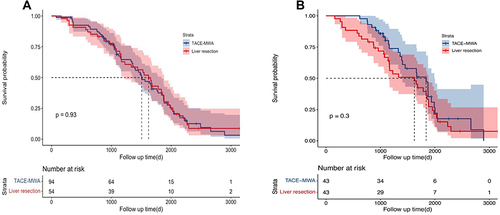
Figure 3 Subgroup analysis between patients with tumor size <7cm and ≥7cm. There was no significant difference in the OS in patients with HCC patients with tumor size <7cm. P = 0.6) between the two groups. In patients with HCC ≥7cm, the OS of patients in the TACE-MWA group showed better efficacy in the liver resection group (P = 0.041).
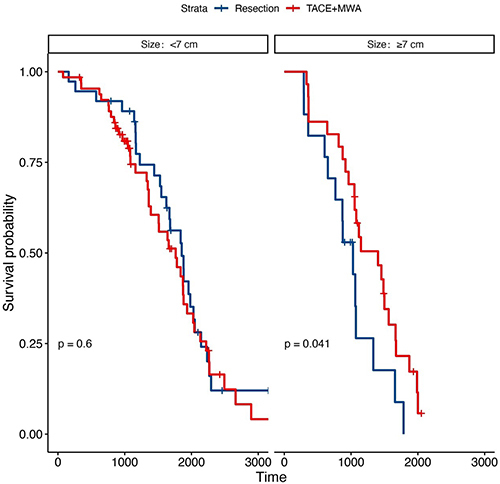
Table 2 Univariate and Multivariate Analyses of Prognostic Factors for Overall Survival in Patients with Solitary Large HCC and in the Propensity Score-Matched Cohort
Figure 4 Progression-free survival (PFS) of patients before or after propensity score matching. (A) There is no significant difference in terms of PFS in the TACE-MWA group and liver resection group. (P = 0.12). (B) In the propensity score-matched cohort, TACE-MWA showed comparable PFS to liver resection (P = 0.66).
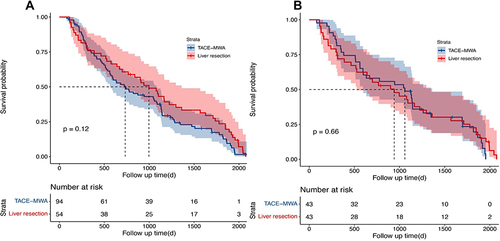
Table 3 Univariate and Multivariate Analyses of Prognostic Factors for Progression Free Survival in Patients with Solitary Large HCC and in the Propensity Score-Matched Cohort
Table 4 Safety in Patients with Solitary Large HCC Before and After PSM