
Figures & data
Table 1 The Detailed Information of the Primary and Second Antibodies in This Research
Figure 1 Gene alteration and expression profiles of SLC10 family genes in liver cancer. (A) Rates of genetic alteration of SLC10 family genes in live cancer based on TCGA-LIHC dataset. SLC10 family genes ((B) SLC10A1, (C) SLC10A2, (D) SLC10A3, (E) SLC10A4, (F) SLC105, (G) SLC10A6, (H) SLC10A7) were abnormally expressed between normal tissues and malignant liver tissues. **Stands for P<0.01, ***Stands for P<0.0001.
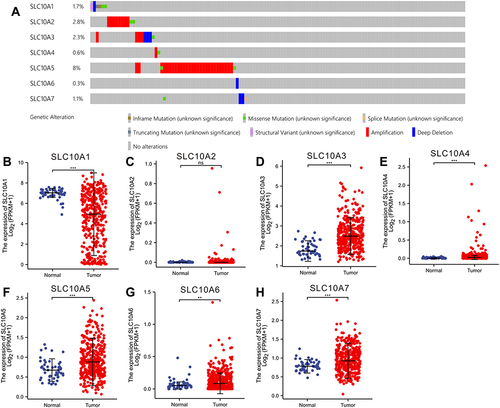
Figure 2 Correlation analysis of SLC10 family genes in liver cancer. Most members of SLC10 family genes were correlated with each other (A). Expression of SLC10A3 was reversely associated with SLC10A1 (B) and SLC10A5 (C). Expression of SLC10A6 was strongly correlated with SLC10A7 with a positive coefficient (D).
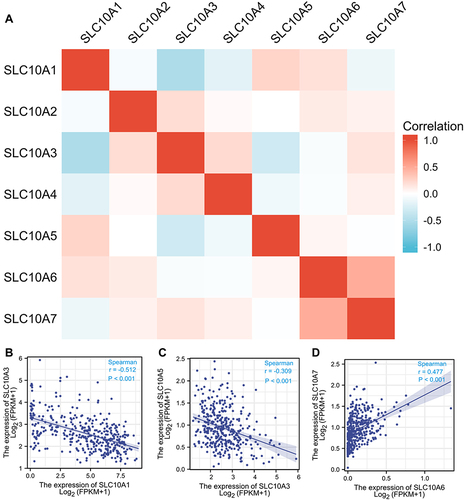
Figure 3 Survival curves of SLC10 family genes in liver cancer based on TCGA-LIHC dataset. Expressions of SLC10 family genes ((A) SLC10A1, (B) SLC10A2, (C) SLC10A3, (D) SLC10A4, (E) SLC10A5, (F) SLC10A6, (G) SLC10A7) were significantly associated with the overall survival among liver cancer people. Over-expressions of SLC10A1 (H), SLC10A2 (I) and SLC10A6 (J) were remarkably linked to the disease-free survival among liver cancer people, while expressions of SLC10A3 (K), SLC10A4 (L), SLC10A5 (M) and SLC10A7 (N) have no significant relationship with disease-free survival among liver cancer people.
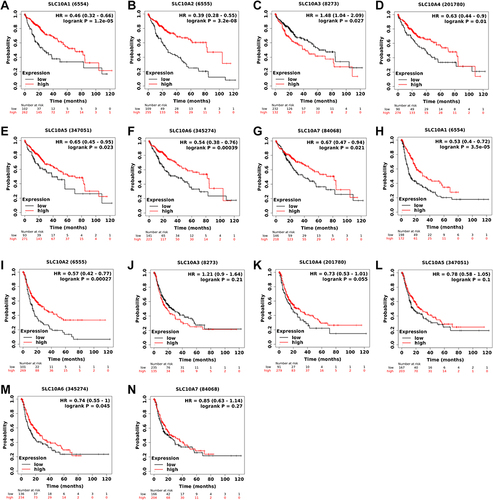
Figure 4 Methylation status of SLC10 family genes in liver cancer based on TCGA-LIHC dataset. Methylation levels of SLC10 family genes were significantly different between normal tissues and malignant liver tissues ((A) SLC10A1, (B) SLC10A2, (C) SLC10A3, (D) SLC10A4, (E) SLC10A5, (F) SLC10A6, (G) SLC10A7). The scatter plots of correlations between expression of SLC10 family genes and DNA methylation in liver cancer ((H) SLC10A1, (I) SLC10A2, (J) SLC10A3, (K) SLC10A4, (L) SLC10A5, (M) SLC10A6, (N) SLC10A7). **Stands for P<0.01, ***Stands for P<0.0001.
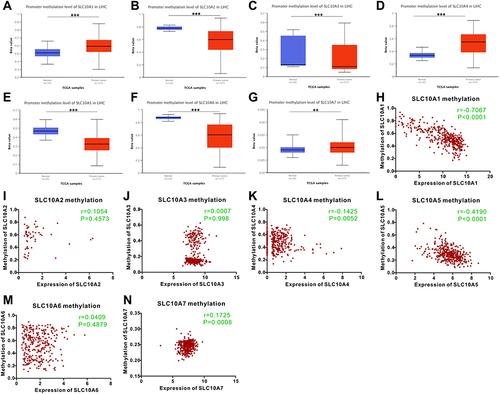
Figure 5 Expression of SLC10 family genes in liver cancer with different immune subtypes and molecular subtypes. Expression of SLC10A1 (A), SLC10A3 (B), SLC10A5 (C), SLC107 (D) is significantly different among five immune subtypes of liver cancer. Expression of SLC10A1 (E), SLC10A3 (F), SLC10A5 (G) is significantly different among three molecular subtypes of liver cancer, while expression of SLC10A7 (H) is not significantly different in three molecular subtypes of liver cancer.
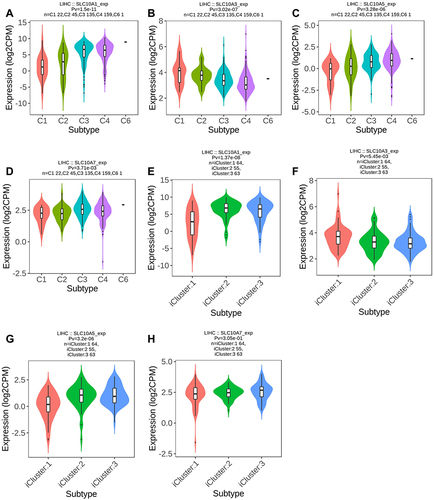
Figure 6 Correlation analyses of SLC10 family genes and 24 immune cells measured by ssGSEA in liver cancer. (A) SLC10A1, (B) SLC10A2, (C) SLC10A3, (D) SLC10A4, (E) SLC10A5, (F) SLC10A6, (G) SLC10A7.
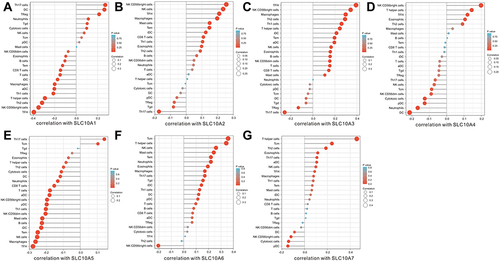
Figure 7 Comparison of enrichment score of nine immune cells between low and high SLC10A3 groups in HCC tissues based on the ssGSEA algorithm. (A) B cells. (B) CD8 T cells. (C) CD4+ T cells. (D) macrophages. (E) Neutrophils. (F) Dendritic cells. (G) Mast cells. (H) Eosinophils. (I) NK cells. *Stands for P<0.05, **Stands for P<0.01, ***Stands for P<0.0001.
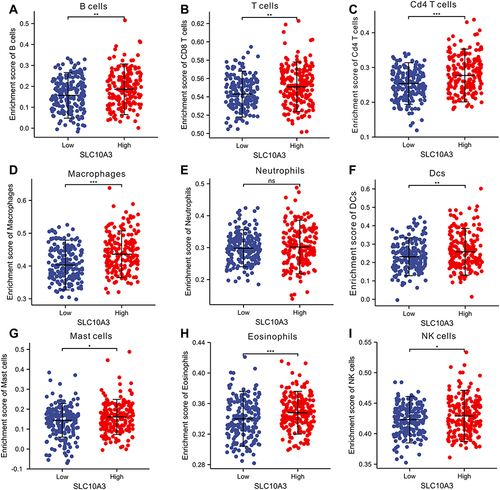
Figure 8 Correlation analyses of SLC10 family genes and immune checkpoints (PD1 and PD-L1) measured by TIMER algorithm in liver cancer. (A) Correlation between CD274 and SLC10A1. (B) Correlation between PDCD1 and SLC10A1. (C) Correlation between CD274 and SLC10A2. (D) Correlation between PDCD1 and SLC10A2. (E) Correlation between CD274 and SLC10A3. (F) Correlation between PDCD1 and SLC10A3. (G) Correlation between CD274 and SLC10A4. (H) Correlation between PDCD1 and SLC10A4. (I) Correlation between CD274 and SLC10A5. (J) Correlation between PDCD1 and SLC10A5. (K) Correlation between CD274 and SLC10A6. (L) Correlation between PDCD1 and SLC10A6. (M) Correlation between CD274 and SLC10A7. (N) Correlation between PDCD1 and SLC10A7.
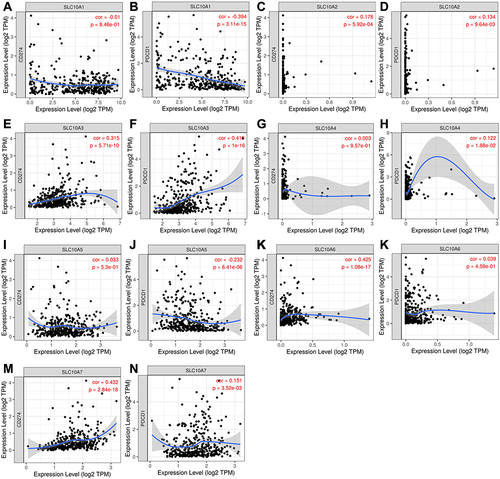
Figure 9 Seven-colour multiplex analysis of human malignant liver tissues. (A) Representative image showing the same TMA core after multispectral imaging. (B) Cell phenotype map defined by the seven markers in the multiplex staining. (C-I) Each of the individual markers in the composite image after spectral unmixing ((C) SLC10A3, (D) CD4, (E) CD20, (F) CD68, (G) DAPI, (H) PD-1, (I) PD-L1). (J) The merged picture of seven markers after multispectral imaging. (A) Is the entire view of one case of malignant liver tissue, and the yellow box is the random area for magnified view, which is corresponding to (C–J) with different markers.
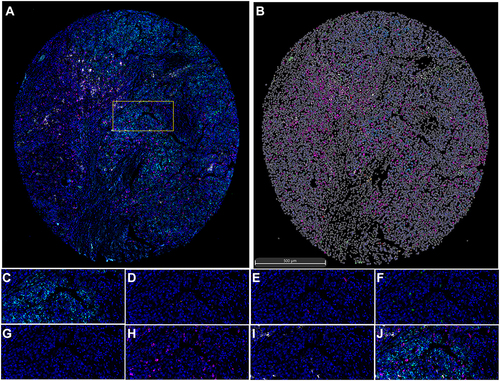
Figure 10 Comparison of expression of SLC10A3 at the protein level between normal liver tissues and HCC tissues. (A) total SLC10A3 positive cells (%), (B) total SLC10A3 cell density, (C) total SLC10A3 average cell intensity, (D) tumor SLC10A3 positive cells (%), (E) tumor SLC10A3 cell density, (F) tumor SLC10A3 average cell intensity, (G) stromal SLC10A3 positive cells (%), (H) stromal SLC10A3 cell density, (I) stromal SLC10A3 average cell intensity. *Stands for P<0.05, **Stands for P<0.01, ***Stands for P<0.0001.
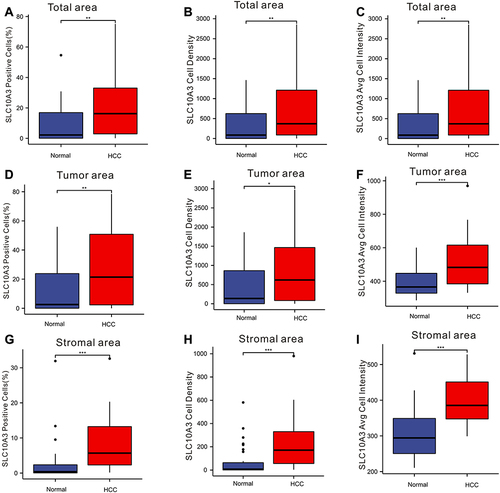
Table 2 Correlation Analysis of SLCA3 Expression with Common Immune Related Markers in Malignant Liver Tissues