Figures & data
Figure 1 Flow chart of the study design.
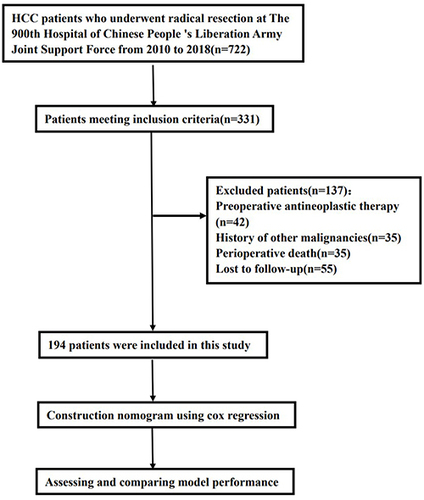
Table 1 Baseline and Clinicopathological Characteristics of Alpha-Fetoprotein-Negative Hepatocellular Carcinoma Patients
Table 2 Univariate and Multivariate Cox Analyses for Recurrence-Free Survival of Alpha-Fetoprotein-Negative Hepatocellular Carcinoma Patients
Figure 2 Relationship of independent risk factors with recurrence-free survival (RFS) in alpha-fetoprotein-negative hepatocellular carcinoma patients. (A) RFS of patients with platelet–albumin-bilirubin (PALBI) scores <-5.95 was longer than that of patients with PALBI scores ≥-5.95. (B) RFS of patients with microvascular invasion (MVI) was longer than that of patients without MVI. (C) RFS of patients with tumor size <5 cm was longer than that of patients with tumor size ≥5 cm.
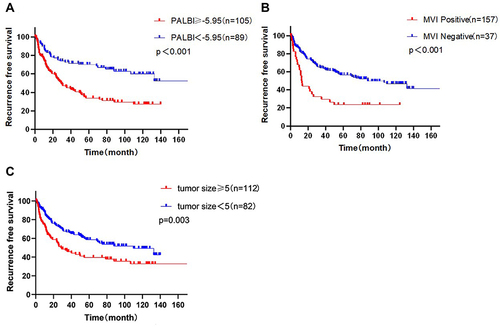
Figure 3 Development of nomogram prediction model for recurrence-free survival (RFS). (A) Nomogram prediction model. (B) Receiver operating characteristic curve for the nomogram prediction model. (C–E) Calibration curves of the nomogram for predicting 1-, 3-, and 5-year RFS rates.
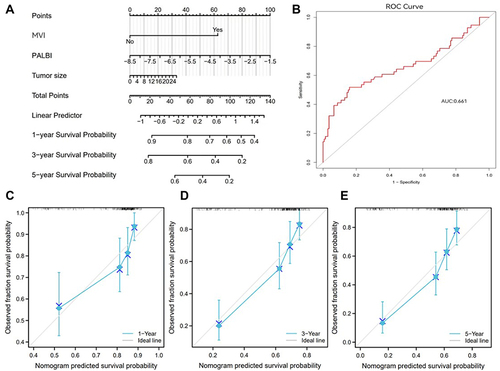
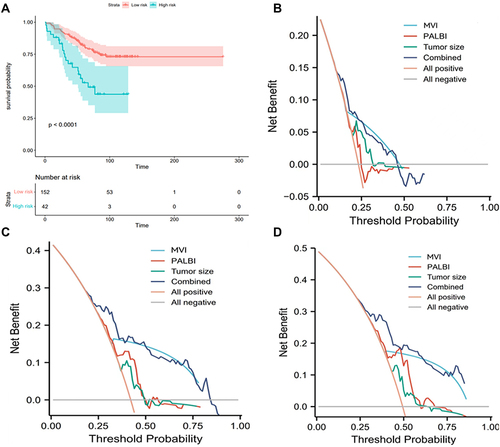
Figure 4 Prognostic assessment and risk stratification of the nomogram prediction model. (A) Risk stratification for recurrence-free survival (RFS). (B–D) Decision curve analyses of 1-, 3-, and 5-year RFS rates show an increase in net benefit.