Figures & data
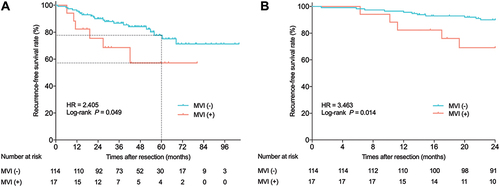
Figure 1 Flow chart of patient inclusion and exclusion.
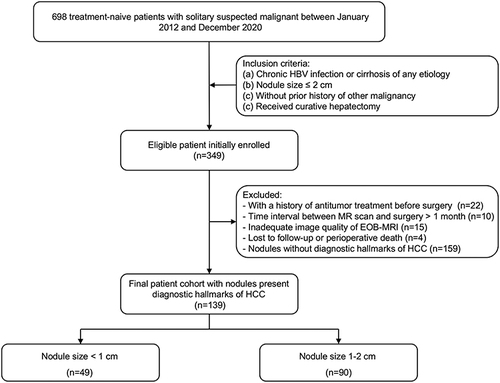
Table 1 Baseline Characteristics of Patients with Lesions Presenting Diagnostic Hallmarks of HCC
Table 2 Histological Type of Nodules with Typical Imaging Features of HCC
Figure 2 A 7.3mm pathologically proven HCC in a 62-year-old man with hepatitis B virus infection. Axial T2-weighted images reveal a nodule (arrow) with mild hyperintensity in S2 of the liver (A). This nodule exhibit restricted diffusion (arrow) in DWI (b = 500 seconds/mm2) and ADC (B and C), homogeneous hyperenhancement (arrow) on arterial phase (D), nonperipheral washout (arrow) on portal venous phase (E), and hypointensity (arrow) on hepatobiliary phase (F). Pathologic evaluation for resected specimen demonstrated an Edmondson grade II HCC without microvascular invasion. During a follow-up period of 96.5 months, no recurrence occurred.
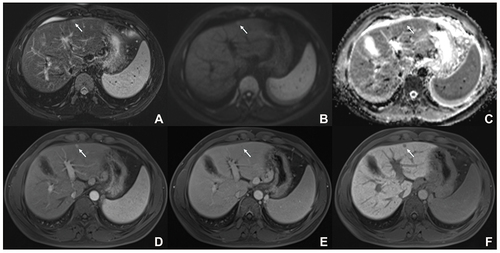
Table 3 Comparison of Pathological Variables Between HCC of Different Sizes
Figure 3 Overall and recurrence-free survival in 131 patients with solitary HCC up to 2 cm. (A and B) Kaplan–Meier curves for recurrence-free survival (A) overall survival (B) and after surgical resection of total HCC cohort. (C and D) Kaplan–Meier curves for overall recurrence (C) and early recurrence (D) after surgical resection of HCC according to tumor size.
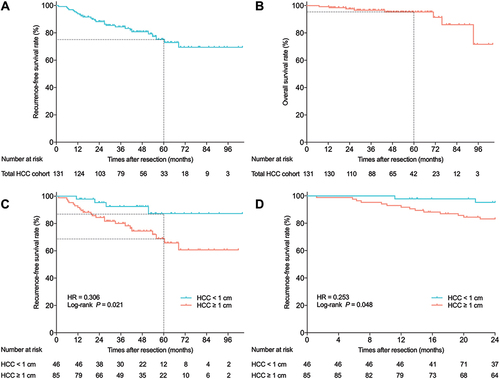
Table 4 Univariable and Multivariable Analysis for Overall and Early Recurrence in HCC Cohort
Figure 4 Kaplan–Meier curves of overall recurrence (A) and early recurrence (B) showing a comparison between patients with and without microvascular invasion.