
Figures & data
Figure 1 (A): Flowchart of the patient cohort. (B): The schema of the combination therapy.
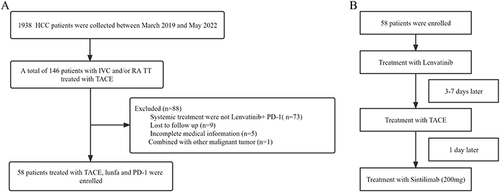
Table 1 Characteristics of the Enrolled 58 Patients with HCC
Table 2 Intra-Hepatic Tumor Response Was Evaluated in 58 Patients
Figure 2 PFS and OS of the entire cohort of HCC patients. Kaplan–Meier estimates of mOS among entire 58 patients (a), mPFS according to mRECIST among all 58 patients (b), mOS stratified by the presence or absence of PVTT (c), mOS stratified by classification of IVC/RATT (d), mOS stratified by the presence or absence of M (M means metastasis) (e), mOS stratified by the treatment of IVC/RATT response (f).
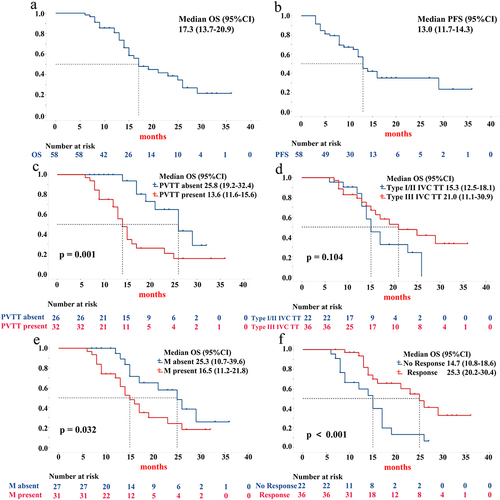
Figure 3 Percentage changes from baseline, summed diameters of tumors (a) and IVC/RATT (b) by mRECIST. (c) Kaplan–Meier estimates of mPFS of IVC/RATT. Red represents patients with PD, green represents SD, and blue represents CR or PR.
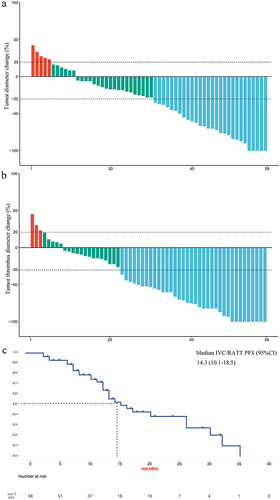
Figure 4 Hepatic artery (arrow, a) angiography showing feeding IVC/RA TT; Contrast-enhanced CT showed a huge hepatocellular carcinoma nodule (arrow, b), together with HVTT (arrow, c) and IVCTT (arrow, d); Right inferior phrenic artery (arrow, e) angiography showing feeding IVC/RA TT; CT images after combined treatment showed that large amounts of iodized oil were deposited in the primary lesion (arrow, f) and IVC/RATT (arrow, g and h) with decreases in the sizes of the tumor and tumor thrombus. HVTT, hepatic vein tumor thrombus.
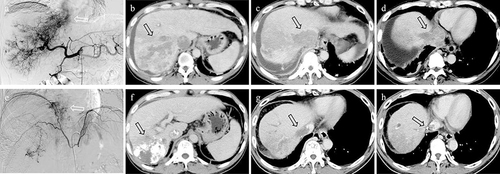
Figure 5 Median PFS (a) and median OS (b) stratified by the PCT level (0.13 ng/mL cutoff).
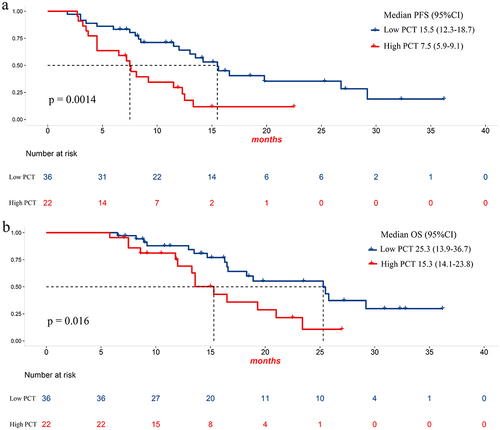
Table 3 Univariate and Multivariate Analysis of the Clinical Characteristics Associated with OS
Table 4 Treatment-Related Adverse Events