
Figures & data
Figure 1 CONSORT diagram.
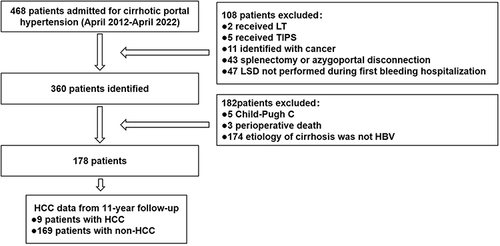
Table 1 Demographic and Preoperative Clinical Characteristics Between Non-HCC and HCC Groups in Unadjusted and IPTW Adjusted Population
Table 2 Correlation Analysis of HCC with C-IV, AFP, FIB-4, and IVAFP-FIB-4
Figure 2 Receiver operating characteristic curve analysis to assess the accuracy of candidate variables and the non-invasive predictive indicator in discriminating patients with and without HCC.
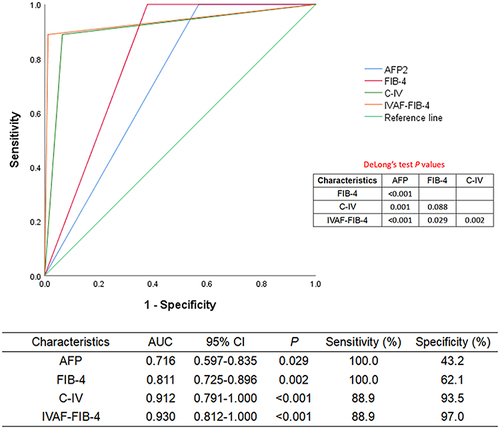
Figure 3 The proportion of occurrence of HCC in HBV-related CPH patients with different groups. (*IVAF-FIB-4: When C-IV level ≥73.95 µg/L, AFP level ≥2.08 ng/mL, and FIB-4 ≥6.917 were met at the same time, the indicator was assigned a value of 1, and the other cases were assigned a value of 0.
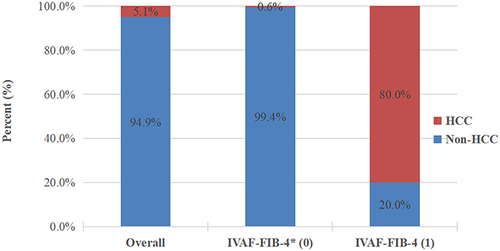
Figure 4 The incidence density of HCC in HBV-related CPH patients with different groups. (*IVAF-FIB-4: When C-IV level ≥73.95 µg/L, AFP level ≥2.08 ng/mL, and FIB-4 ≥6.917 were met at the same time, the indicator was assigned a value of 1, and the other cases were assigned a value of 0.
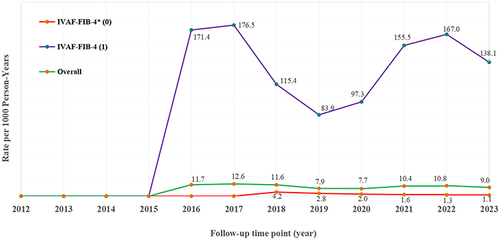
Table 3 Logistic Regression Analysis of Occurrence of HCC in Unadjusted and IPTW Adjusted Population