
Figures & data
Table 1 Baseline Parameters
Table 2 Response Rates
Figure 1 “Overall and progression free survival” (A) Kaplan-Meier graph of overall survival: p=0.088 (Log rank test) (B) Kaplan-Meier graph of progression free survival: p=0.075 (Log rank test). Global p-values are shown. Tick marks indicate censored data.
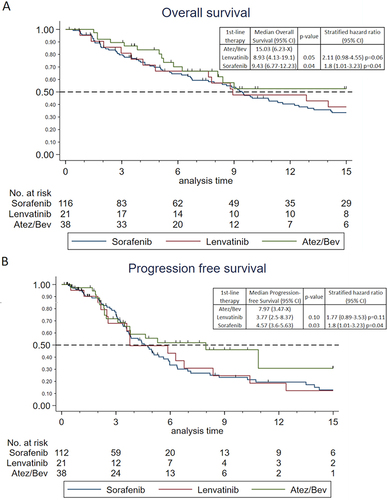
Figure 2 Progression free survival for different subgroups (A) CHILD A; (B) CHILD B; (C) ALBI 1; (D) ALBI 2/3; (E) Alc, Alcohol; (F) NASH, non-alcoholic steatohepatitis; (G) HepB, hepatitis B; (H) HepC, hepatitis C; (I) TACE, transarterial chemoembolization; (J) SIRT, selective internal radiation therapy; (A-J, each Log rank test, CI: confidence interval) p-values and hazard ratios are for direct comparison to Atez/Bev.
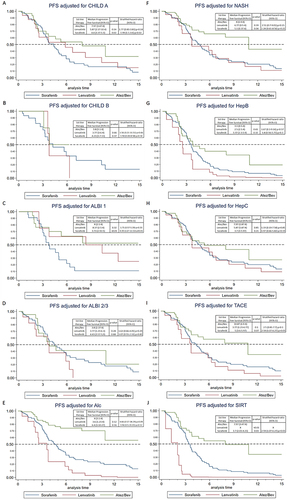
Figure 3 Hazard ratios of individual parameters regarding PFS prediction depicted with 95% confidence intervals after using the Cox-proportional hazards model. Values >1 indicate a bad influence on PFS with higher grade of the parameter. Exception are the thrombocytes with lower values increasing the hazard ratio. Age is grouped in 10-year steps for better representability. Main vessel means macroscopic main vessel infiltration. (Cox Regression).
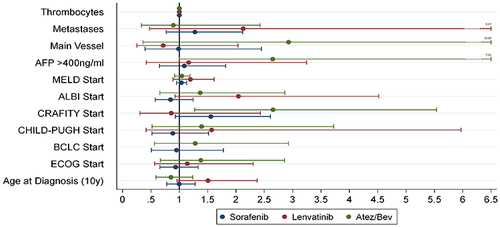
Table 3 Frequency of Adverse Events