
Figures & data
Table 1 Patient Characteristics (n = 194)
Table 2 Comparison of Our Bronx Cohort with IMbrave150 and SEER Data
Figure 1 Kaplan–Meier analysis of survival data in relation to clinic-pathological variables. Survival rates are shown for: (A) all patients; (B) patients stratified by Child-Pugh score at initiation of ICI; (C) patients stratified by baseline MELD-Na score. Low MELD is 6–18, high MELD is 19–40. ****p-value<0.0001.
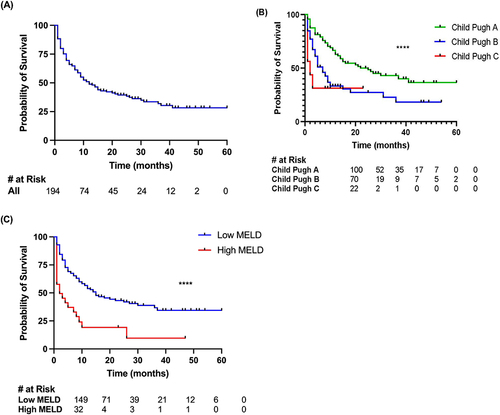
Figure 2 Kaplan–Meir analysis of survival data. (A) Patients stratified by baseline AFP serum level with low AFP defined as < 400. p-value=0.162; (B) patients stratified by delta AFP at 3 months. dAFP is the change in AFP level between T0 and T+3 months. ns p-value>0.05. **p-value<0.01.
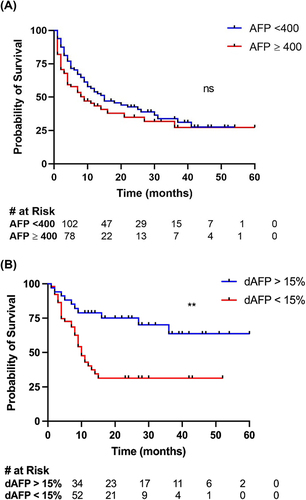
Figure 3 Kaplan–Meier analysis of survival data based on etiology and HCV Treatment. (A) Patients are stratified by viral or non-viral etiology of chronic liver disease. p-value 0.44; (B) patients are stratified by hepatitis (C) treatment status in eligible patients. ns p-value>0.05. **p-value<0.01.
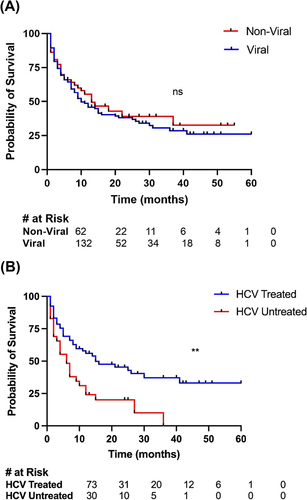
Table 3 Presentation of Immune-Related Adverse Events and High-Grade irAEs
Table 4 Predictors of Overall Survival in Multivariate Analysis
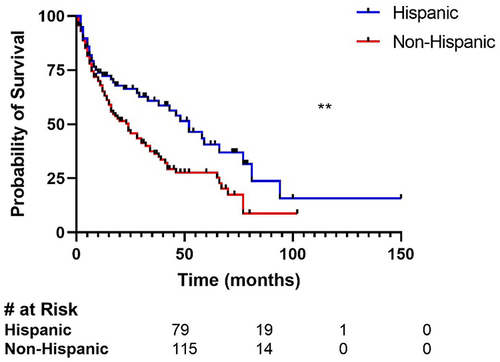
Figure 4 Kaplan–Meier analysis of survival with patients stratified by ethnicity. **p-value<0.01.
Data Sharing Statement
Data will be available to editors, reviewers, and readers upon reasonable request from the corresponding author Yvonne Saenger.