Figures & data
Figure 1 Patients selection flow diagram.
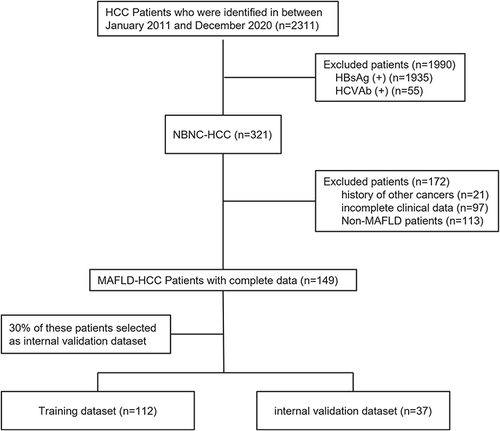
Table 1 Baseline Characteristics of Patients with MAFLD-HCC
Table 2 Univariate Cox Regression Analysis of Risk Factors of Survival in Training Cohort
Table 3 Multivariate Cox Regression Analyses of Risk Factors of Survival in Training Cohort
Figure 2 Nomogram predicting OS in patients with MAFLD-HCC.
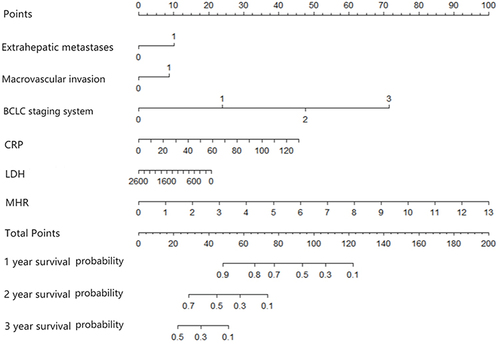
Figure 3 The calibration curves for predicting the 1-, 2-, and 3-year nomogram in the training cohort(A) and validation cohort(B).
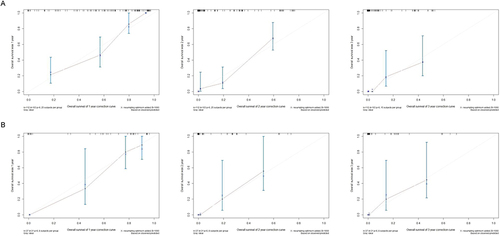
Figure 4 ROC curve analysis for 1‑, 2‑, and 3‑year in the training cohort(A) and validation cohort(B).
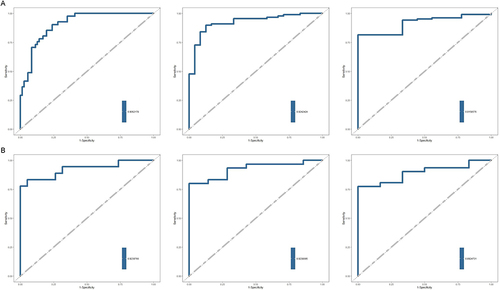
Figure 5 ROC curve analysis of MHR for 1‑year (A), 2‑year (B), and 3‑year (C).
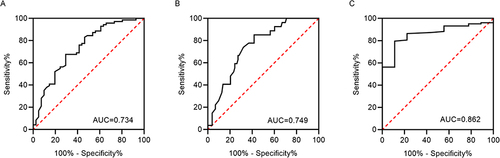
Figure 6 Kaplan-Meier curve analysis of MHR for 12-month (A), 24-month (B), and 36-month (C).
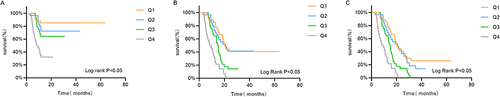
Figure 7 ROC curve analysis of ALBI Grade for 1‑year (A), 2‑year (B), and 3‑year (C).
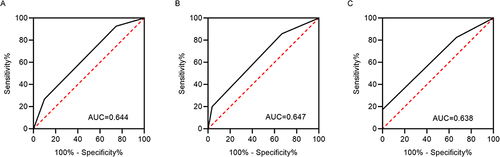
Figure 8 Kaplan-Meier curve analysis of ALBI Grade for 12-month (A), 24-month (B), and 36-month (C).
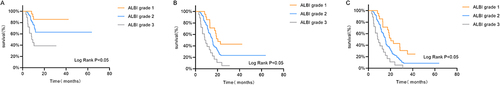
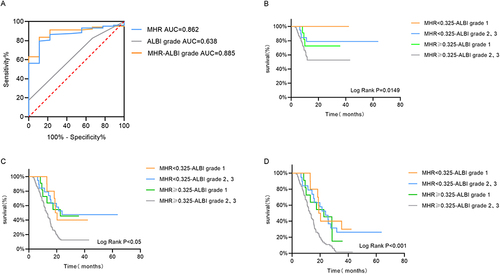
Figure 9 ROC curve analysis of MHR-ALBI for 3-year (A); Kaplan-Meier curve analysis of MHR-ALBI for 12-month (B), 24-month (C), and 36-month (D).