Figures & data
Table 1 Baseline Characteristics of the Patients
Figure 1 KM curves measuring the RFS of patients in the CECT and NECT groups.
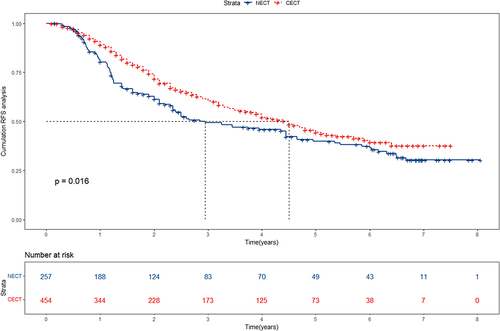
Figure 2 Screening of variables based on Lasso regression which employs a loss function with L1 regularization to penalize model coefficients while minimizing the objective function. This technique governs the rigor of feature selection by adjusting the regularization parameter (λ). An increase in λ results in more coefficients converging towards zero, facilitating feature screening and reducing the model’s dimensionality. (A) The variation characteristics of the coefficient of variables; (B) the selection process of the optimum value of the parameter λ in the Lasso regression model by cross-validation method.
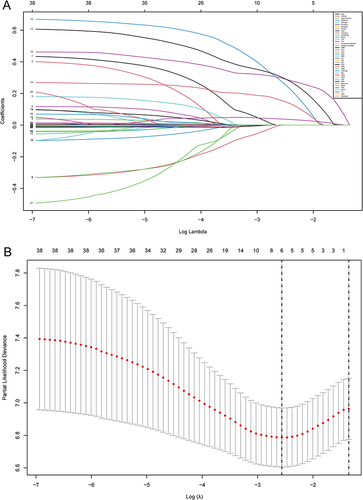
Figure 3 Nomogram used to predict time-related recurrence in patients with early-stage HCC to whom CECT was applied after ablation.
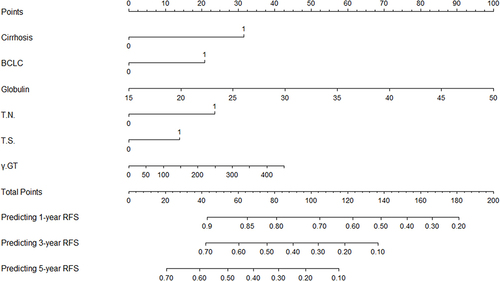
Figure 4 ROC curve of the nomogram in the training cohort and validation cohort. (A) In the training cohort, the AUCs for 1-, 3- and 5-year RFS were 0.867, 0.731 and 0.773, respectively.(B) In the validation cohort, the AUCs for 1-, 3- and 5-year RFS were 0.896, 0.784 and 0.773, respectively.
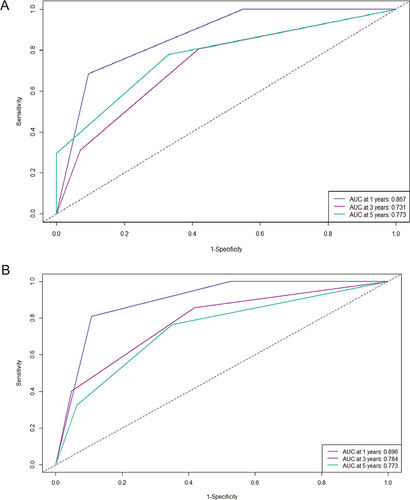
Figure 5 Calibration curve of the nomogram in the training cohort and validation cohort, with the x-axes actual recurrence estimated by the nomogram, the y-axes are observed recurrence calculated by the KM method. (A–C) training set; (D–F) validation set.
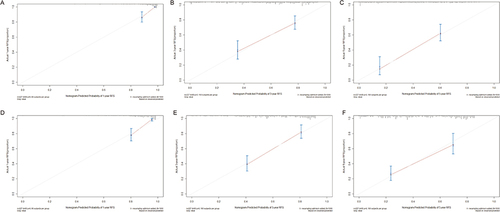
Figure 6 Decision curve analysis for recurrence in the training and validation cohort. (A–C) Decision curve analysis for 1-, 3- and 5-year RFS in the training cohort. (D–F) Decision curve analysis for 1-, 3- and 5-year RFS in the validation cohort.
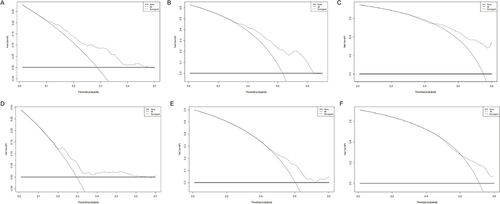
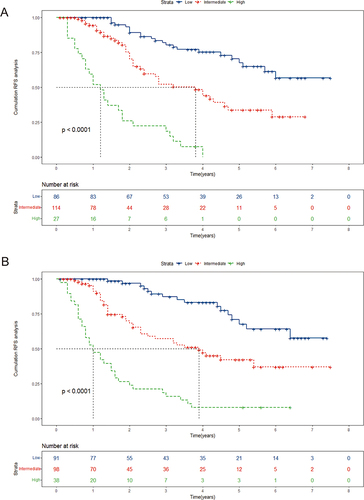
Figure 7 Kaplan-Meier plots of RFS for the low-risk group, medium-risk group and high-risk group in the training and validation cohort. (A) training set; (B) validation set.