Figures & data
Table 1 Demographics and Clinical Characteristics for Training and Validation Cohorts
Figure 1 Screening of variables based on Lasso regression. (A) The variation characteristics of the coefficient of variables. (B) the selection process of the optimum value of the parameter λ in the Lasso regression model by cross-validation method.
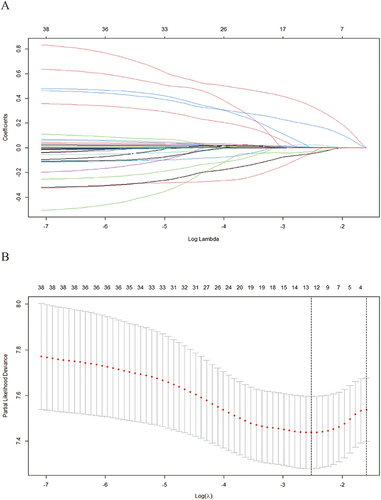
Table 2 Multivariate Cox Regression Analysis Based on the Results of Lasso Regression
Figure 2 Nomogram, including age, TN, TS and GGT for 1-, 3- and 5-year RFS in patients with AFP and DCP double-negative HCC.
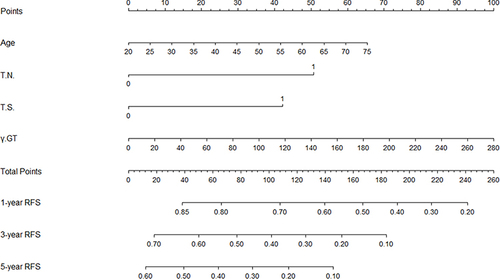
Figure 3 ROC curves of the nomogram in the training and validation cohort. (A) In the training cohort, the AUCs for 1-, 3- and 5-year RFS were 0.738, 0.742 and 0.836, respectively. (B) In the validation cohort, the AUCs for 1- and 3-year RFS were 0.758 and 0.821, respectively.
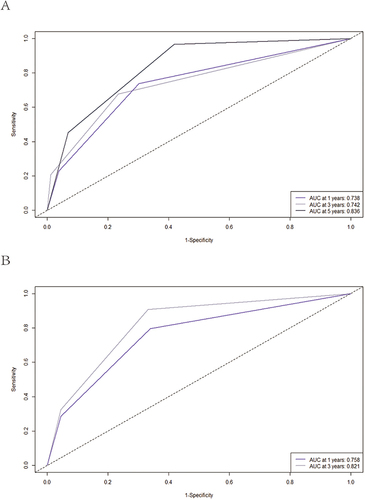
Figure 4 Calibration curves of the nomogram in the training and validation cohort. (A) training cohort; (B) validation cohort.
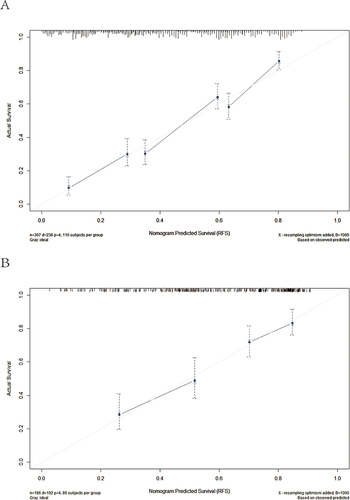
Figure 5 DCA for recurrence in the training and validation cohort. (A–C) DCA for 1-, 3- and 5-year RFS in the training cohort. (D and E) DCA for 1-, and 3-year RFS in the validation cohort.
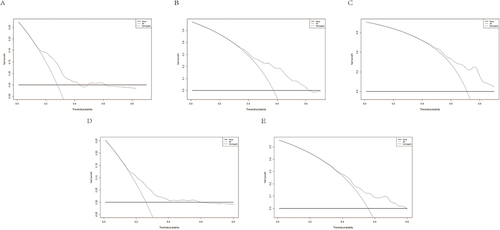
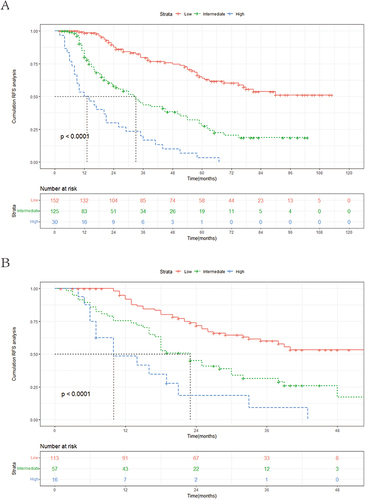
Figure 6 Kaplan–Meier curves for the low-risk group, intermediate-risk group, and high-risk group in the training and validation cohort. (A) training cohort; (B) validation cohort.