Figures & data
Figure 1 Distribution of risk factors and stages of HCC. (A) Distribution of risk factors for HCC. (B) Distribution of the different stages of HCC as per BCLC classification.
Abbreviations: BCLC, Barcelona Clinic Liver Cancer; HCC, hepatocellular carcinoma; NAFLD, non-alcoholic fatty liver disease; NASH, non-alcoholic steatohepatitis.
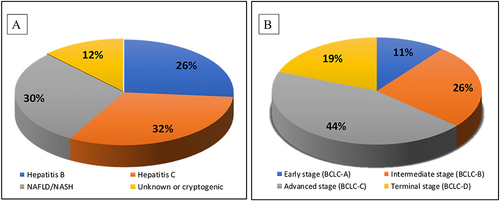
Figure 2 Algorithm for HCC diagnosis.
Notes: Adapted from Alqahtani S, Sanai F, Alolayan A, et al. Saudi Association for the Study of Liver diseases and Transplantation practice guidelines on the diagnosis and management of hepatocellular carcinoma. Saudi J Gastroenterol. 2020;26(7):1. Creative Commons.Citation7
Abbreviations: APHE, arterial phase hyperenhancement; CT, computed tomography; HCC, hepatocellular carcinoma; MRI, magnetic resonance imaging; USG, ultrasonography.
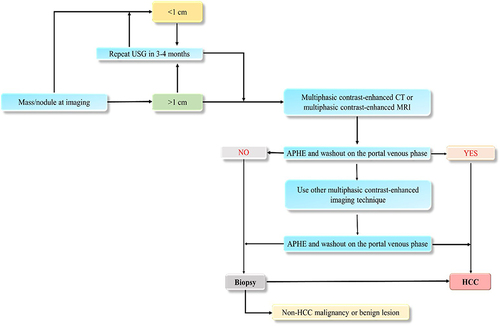
Figure 3 Commonly used locoregional treatments for HCC in Saudi Arabia.
Abbreviations: HCC, hepatocellular carcinoma; MWA, microwave ablation; PEA, percutaneous ethanol ablation; RFA, radiofrequency ablation; TACE, transarterial chemoembolization; TARE, transarterial radioembolization.
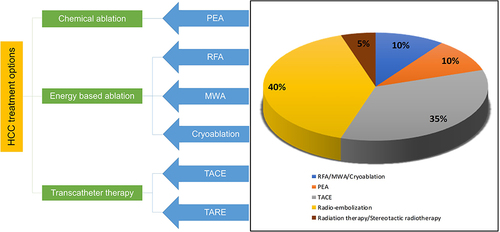
Figure 4 Factors to be considered when evaluating patients for TACE.
Abbreviations: AFP, alfa-fetoprotein; ALBI, albumin-bilirubin; ECOG, Eastern Cooperative Oncology Group; TACE, transarterial chemoembolization.
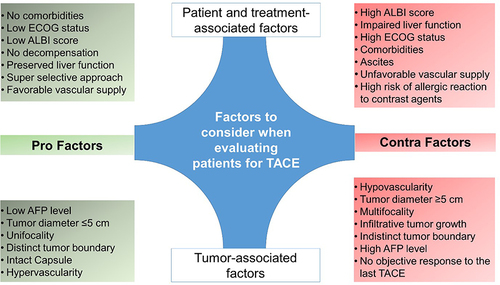
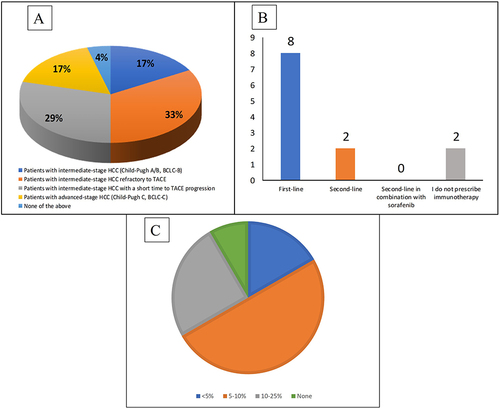
Figure 5 Eligibility criteria for systemic therapy. (A) Percentage of patients eligible for systemic therapy. (B) Majority of experts prescribed immunotherapies mostly in first-line setting (C) Percentage of patients prescribed with sorafenib.
Abbreviations: BCLC, Barcelona Clinic Liver Cancer; HCC, hepatocellular carcinoma; TACE, transarterial chemoembolization.