Figures & data
Figure 1 Expression patterns and prognostic potential of PRMT1 in HCC. (A) The expression of PRMT1 in pan cancers. (B) The expression of PRMT1 liver cancers. (C) The expression of PRMT1 was significantly associated with TNM stage based on TCGA results using UALCAN analysis. (D) The expression of PRMT1 was associated with the tumor grade of HCC in TCGA samples using UALCAN database analysis. Grade 1, well differentiated (low grade); Grade 2, moderately differentiated (intermediate grade); Grade 3, poorly differentiated (high grade); Grade 4, undifferentiated (high grade). Statistical significance determined by t-test. **P<0.01; ***P<0.001. (E) Kaplan–Meier survival analysis of PRMT1 expression and OS to compare the five-year survival of HCC patients. (F) Kaplan–Meier survival analysis of PRMT1 expression and disease-free survival in GEPIA.
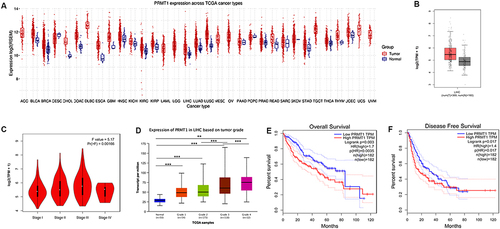
Figure 2 Association of PRMT1 with tumor immune cell infiltration in HCC. (A–D) UMAP dimensionality reduction of scRNA-seq data from non-tumor and HCC patients, (A and B) GSE140226_10×, (C and D) GSE140228_smartseq2. (E) Correlations of PRMT1 with immune infiltrates in HCC. (F) Correlations of PRMT1 expression with abundance of immune cell subtypes. (G) Overall Kaplan–Meier survival curves for patients with HCC and high or low levels of macrophages. Statistical significance determined by t-test. *P<0.05; **P<0.01; ***P<0.001; ****P<0.0001.
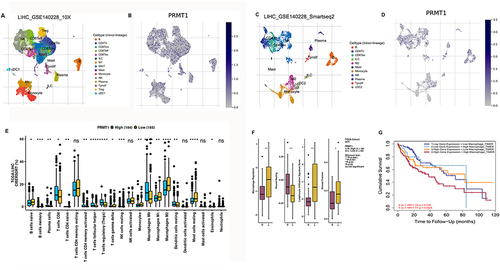
Figure 3 PRMT1 expression in HCC patients treated with immunotherapy. (A) The expression of PRMT1 in the HCC patient’s liver cells of HCC patients treated with immunotherapy. (B and C) UMAP dimensionality reduction of scRNA-seq data from HCC patients treated with immunotherapy. (D) Diagrams of PRMT1 genes expression between different immune cells.
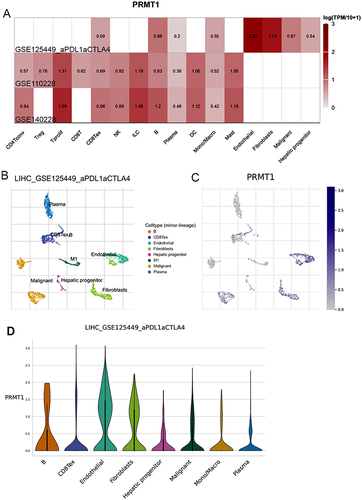
Figure 4 Correlations of differentially expressed PRMT1 and immune infiltration-associated marker genes in HCC. (A) Correlations of PRMT1 expression with immunomodulators, MHC molecules, chemokines, and receptors. (B) Correlations between the PRMT1 expression and immune checkpoints. (C) Correlations between PRMT1 expression and PDCD1, CD274, CLAT4, TGFB1 and IL10 in HCC. *P<0.05; ****P<0.0001.
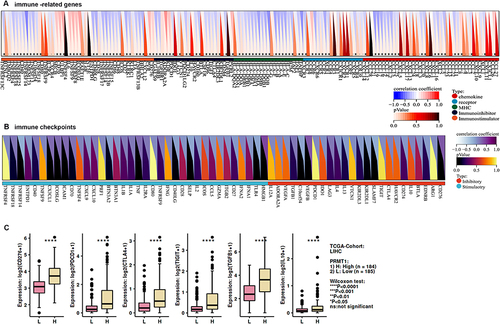
Figure 5 The function of PRMT1 in HCC cells. (A) Cell growth rate was decreased after downregulation of PRMT1 in HCC cells. (B and C) HCC cells with downregulated PRMT1 showed lower motility in a wound healing assay. (D and E) Cell migration ability in PRMT1 knockdown HCC cells analyzed by transwell migration assay. *P<0.05; **P<0.01.
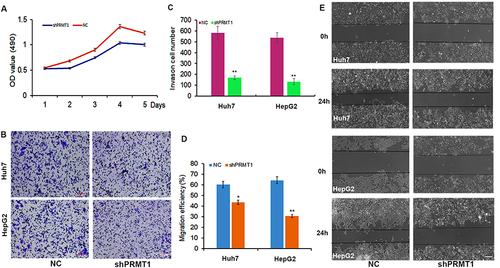
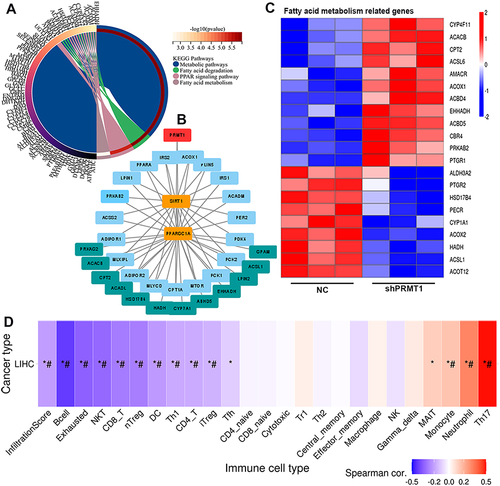
Figure 6 Enrichment analysis of PRMT1 associated genes in LIHC. (A and B) Functional pathways associated with PRMT1 expression from KEGG and GO enrichment analyses. (C) Functional pathways of PRMT1-associated genes. (D) Summary of enrichment analysis of PRMT1-related genes in DisGeNET.
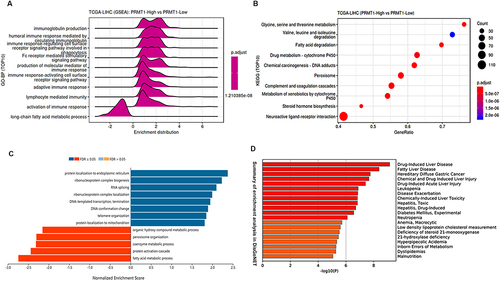
Figure 7 PRMT1 is involved in fatty acid metabolism. (A) Network of PRMT1-related genes and metabolic pathways. (B) Protein interaction network for PRMT1 and proteins related to fatty metabolism. (C) The expression of genes related to fatty acid metabolism in PRMT1-knockdown HCC cells. (D) Correlations of PRMT1-related genes that were also involved in metabolic pathways, with immune infiltrates in HCC. FDR-adjusted P-values are shown *P value ≤ 0.05; #FDR ≤ 0.05.