Figures & data
Figure 1 Flowchart of the study.
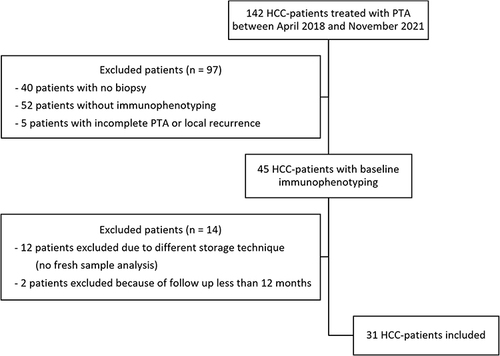
Table 1 Patients’ Characteristics
Figure 2 Immune signature associated with very early HCC recurrence after PTA. (A) Recurrence-free survival of thirty-one patients included in the study: 9 patients (29%) were later categorized into the very early recurrence group and 22 patients (71%) into the prolonged recurrence-free group. The median time between ablation procedure and intrahepatic distant recurrence was 4.5 months [IQR:3.1–9] in the very early recurrence group. (B) The frequencies of circulating PD1+ T cells compared between “prolonged free recurrence group” and “very early recurrence group”. The frequencies of PD1+ T cells, (C) in nontumoral and (D) in tumoral biopsies. (E) The frequencies of circulating TIM3+ T cells. The frequencies of TIM3+ T cells, (F) in nontumoral and (G) in tumoral biopsies. The violin plots show the distribution of the data, with median and quartiles.
![Figure 2 Immune signature associated with very early HCC recurrence after PTA. (A) Recurrence-free survival of thirty-one patients included in the study: 9 patients (29%) were later categorized into the very early recurrence group and 22 patients (71%) into the prolonged recurrence-free group. The median time between ablation procedure and intrahepatic distant recurrence was 4.5 months [IQR:3.1–9] in the very early recurrence group. (B) The frequencies of circulating PD1+ T cells compared between “prolonged free recurrence group” and “very early recurrence group”. The frequencies of PD1+ T cells, (C) in nontumoral and (D) in tumoral biopsies. (E) The frequencies of circulating TIM3+ T cells. The frequencies of TIM3+ T cells, (F) in nontumoral and (G) in tumoral biopsies. The violin plots show the distribution of the data, with median and quartiles.](/cms/asset/11f727e6-17e7-4f76-930e-396484df422c/djhc_a_12299610_f0002_c.jpg)
Table 2 The Baseline Frequency of T Cells Expressing Immune Checkpoint Molecules in Peripheral Blood, Nontumoral and Intratumoral Liver Tissue
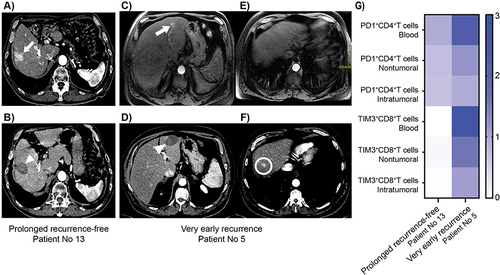
Figure 3 Imaging and immunological profiles of representative patients. (A) Arterial phase axial abdominal CT scan in a 73-year-old man (patient No 13) shows a single 28-mm right liver HCC (white arrow) with peripheral perfusional disturbances at baseline. (B) Arterial phase axial abdominal CT scan of the same patient 45 months after percutaneous thermal ablation shows the ablated area (white arrowhead) without any recurrence. (C) and (E) Arterial phase axial abdominal MRI in a 66-year-old man (patient No 5) shows a single 18-mm left liver HCC (white arrow) at baseline. (D and F) Arterial phase axial abdominal CT scan in the same patient 9 months after percutaneous thermal ablation shows no recurrence at the ablated area (white arrowhead) but a very early intrahepatic distant recurrence in segment VIII (white circle). (G) Immunological profiles of patients No 13 and 5 at baseline. Results are expressed as a heat map-based frequency of positive cells compared with the mean frequency of a corresponding subpopulation of cells of the entire cohort; higher than the mean in dark blue.