Figures & data
Figure 1 Workflow of TACE patient survival prediction model based on deep learning (DLOPcombin).
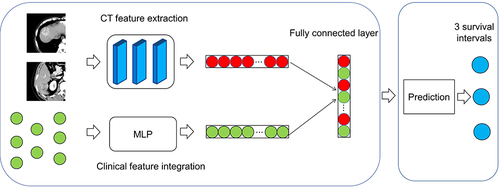
Table 1 Baseline Demographic and Clinical Characteristics
Table 2 Univariate and Multivariate Cox Regression Analysis of Clinical Factors in the Training Cohort
Table 3 Performance of the Model in Predicting the Prognosis of HCC Patients in the Training Cohort and the Validation Cohort
Table 4 Discrimination Performance and Calibration of the Survival Prediction Model
Figure 2 Performance of different survival prediction models. Time-dependent receiver operating curves under the area for 3-year survival of patients (A) training cohort (B) validation cohort. Calibration curves of the model (C) training cohort (D) validation cohort.
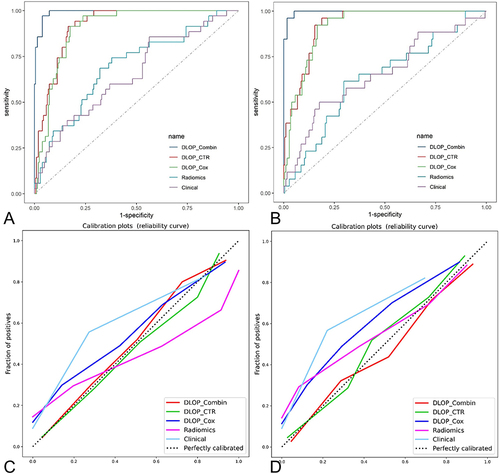
Figure 3 Kaplan-Meier estimates of overall survival according to the Youden index of DLSPcombin categorized high- and low-risk groups (A) training cohort (B) validation cohort.
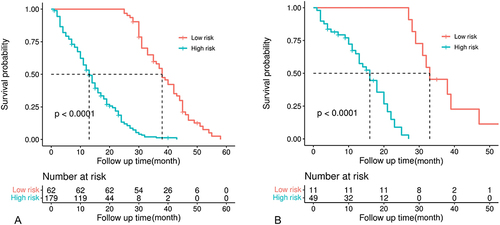
Figure 4 Results of the DeLong test between the different models (A) training cohort (B) validation cohort. Results of the FDR after calibration of the p-value (C) training cohort (D) validation cohort.
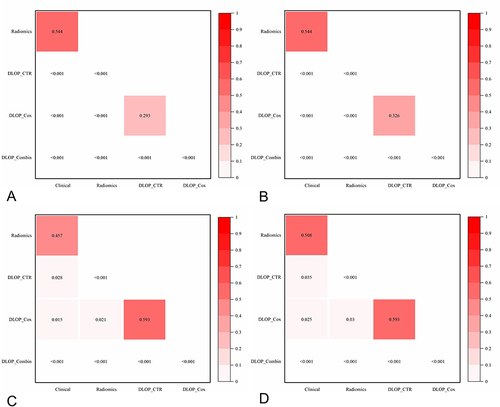
Figure 5 Decision curve analysis of the (A) training cohort (B) validation cohort.
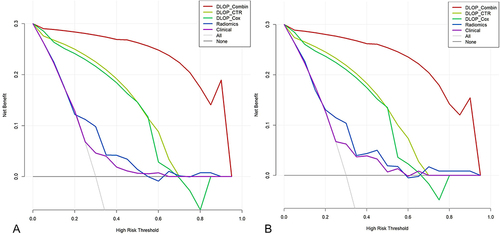
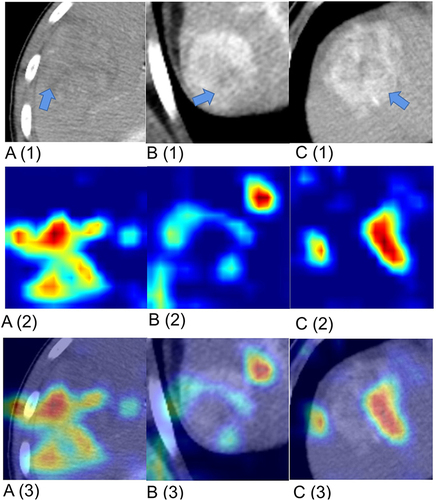
Figure 6 Examples of CT images (A), Heatmap (B), and their corresponding gradient-class activation maps (C) on the validation cohort. On both the heat map and the gradient class activation map, red areas indicate that the area may be associated with a high probability of survival for the patient, while blue lesions indicate a low probability of survival. (A) A 64-year-old woman with 4 years of survival after TACE and Ct-based deep learning survival prediction model activation focused on the tumor region. (B) A 52-year-old male with no internal tumor activation and a disease-free survival of 240 days. (C) The patient with the incorrect prediction, a 48-year-old male, survived 397 days after surgery. The model predicted low risk; however, death occurred after 1254 days.