
Figures & data
Table 1 Baseline Characteristics of Patients in the Two Groups Before and After PSM
Figure 1 Patient flow chart.
Abbreviations: HCC, hepatocellular carcinoma; TACE, transarterial chemoembolization; ICIs, immune checkpoint inhibitors; BCLC, Barcelona Clinic Liver Cancer.
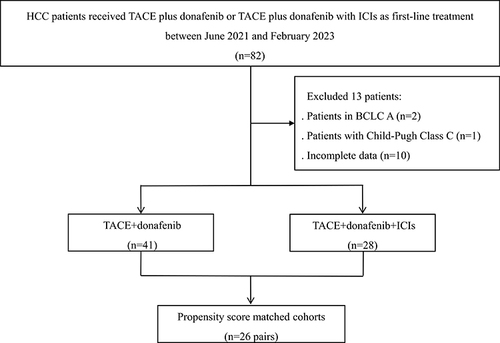
Table 2 Summary of Response Rates Before and After PSM
Figure 2 Kaplan-Meier analyses of progression-free survival (A) and overall survival (B) according to two groups before PSM.
Abbreviations: T+D, transarterial chemoembolization plus donafenib; T+D+I, transarterial chemoembolization plus donafenib with immune checkpoint inhibitors; PSM, propensity score matching.
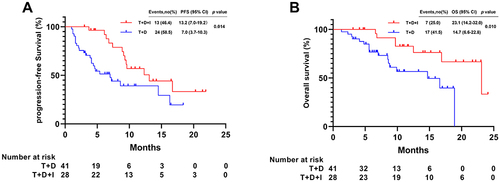
Figure 3 Kaplan-Meier analyses of progression-free survival (A) and overall survival (B) according to two groups after PSM.
Abbreviations: T+D, transarterial chemoembolization plus donafenib; T+D+I, transarterial chemoembolization plus donafenib with immune checkpoint inhibitors; PSM, propensity score matching.
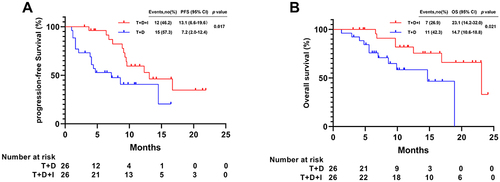
Table 3 Univariate and Multivariate Predictors of Progression-Free Survival and Overall Survival After PSM
Table 4 Treatment-Related Adverse Events