
Figures & data
Figure 1 Flow chart of research design.
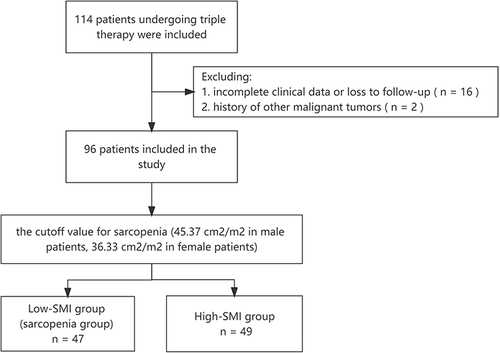
Figure 2 Computed tomographic scans showing areas of skeletal muscle (red, green, and blue), visceral adipose tissue (yellow), and subcutaneous adipose tissue (purple) in patients with sarcopenia (A) and without sarcopenia (B).
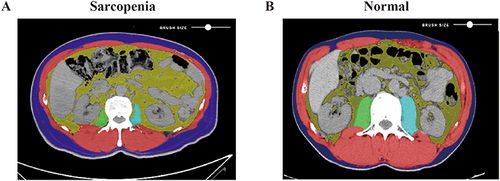
Table 1 The baseline characteristics of all included patients
Table 2 Treatment-related adverse events for all grades
Table 3 The correlation between SMI and BMI, maximum tumor dimension, the total cross-sectional areas of visceral adipose tissue and subcutaneous adipose tissue, PLT, AST, ALP
Table 4 Univariate and multivariate analyses of prognostic factors affecting overall survival
Figure 3 The overall survival (OS) of patients in high and low SMI groups. (A) The Kaplan-Meier curve showed that the OS of the high SMI group was significantly higher than the low SMI group (p < 0.05). (B) The survival heatmap exhibited that with the increase of SMI, the OS of patients is higher and the death is less.
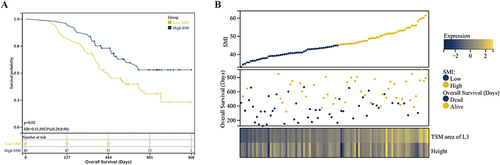
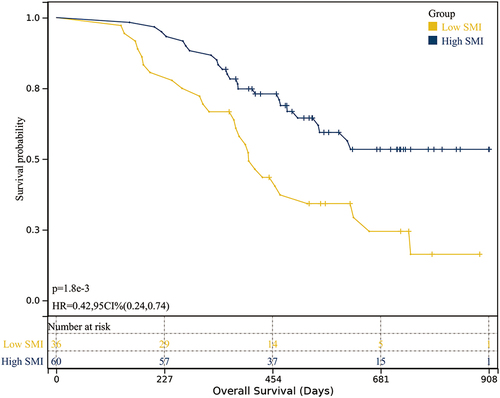
Figure 4 When the optimal cutoff value was selected as the cutoff value for sarcopenia, the difference in overall survival between the high and low SMI groups.
Data Sharing Statement
The raw data supporting the conclusions of this article will be made available by Hongcai Yang and Tianhao Cong, without undue reservation.