Figures & data
Table 1 Patient Characteristics at Baseline
Figure 1 Flowchart of included patients.
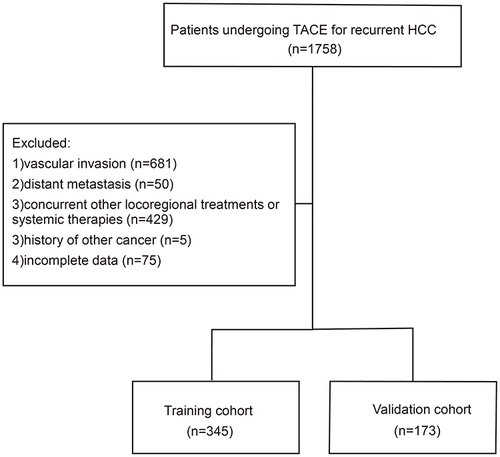
Figure 2 Comparison of overall survival between the training cohort and the validation cohort.
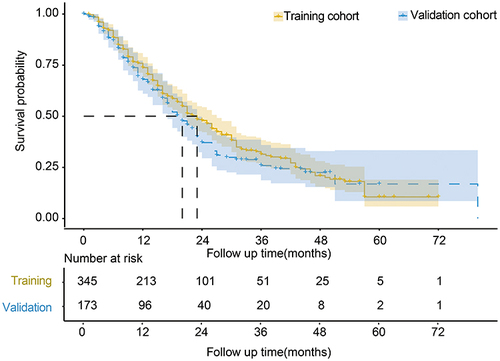
Table 2 Univariate and Multivariate Analyses of Factors Predicting Overall Survival in the Training Cohort
Figure 3 Nomogram for predicting overall survival in patients undergoing TACE for post-resection recurrent HCC. The density plots showed the distribution of total points and tumor diameter. The size of the box represented the distribution of category variables. The importance of each variable was ranked according to the standard deviation along nomogram scales. An example of using the nomogram to predict survival probability of a given patient was displayed. The patient received TACE for two recurrent HCC nodules with the largest diameter of 3.5cm 6 months post hepatectomy. AFP was negative before TACE. Red lines and dots were drawn upward to determine the points received by each variable. Another line was drawn from the sum (72.4) of these points on the Total Points axis downward to the survival axes to determine the probability of 1-year(81.0%), 2-year(58.1%) and 3-year(41.2%) survival.
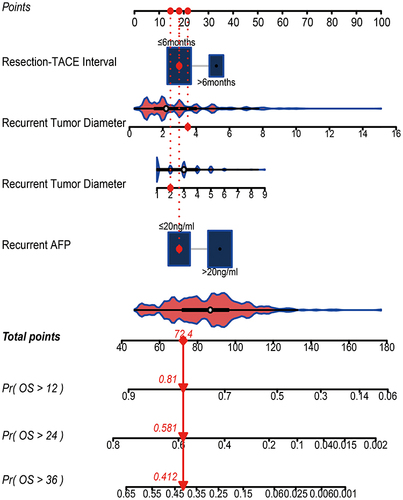
Figure 4 Calibration curve for predicting 3-year survival in the training cohort (upper figure) and the validation cohort (lower figure).
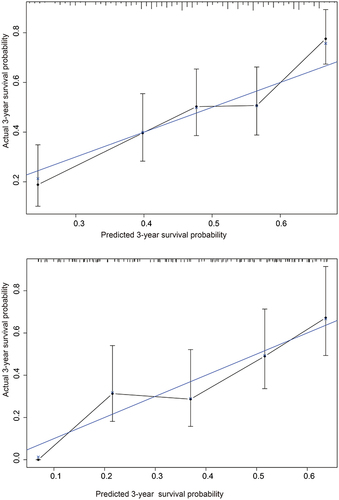
Table 3 Comparisons of AUROC and C-Index Among Different Prognostic Models
Figure 5 Time-dependent AUROC of different models for predicting overall survival in the training cohort (upper figure) and in the validation cohort (lower figure).
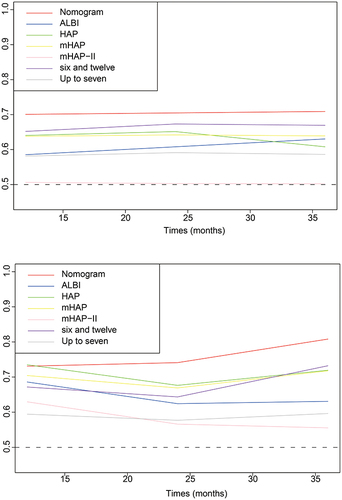
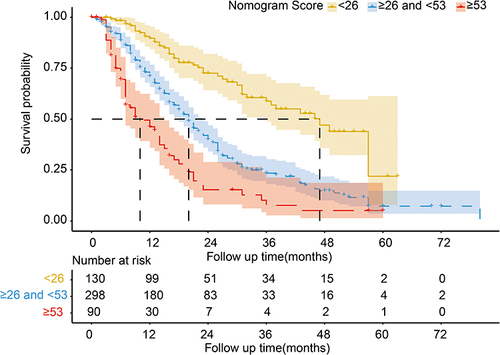
Figure 6 Different risk stratification for overall survival based on the nomogram.