Figures & data
Figure 1 Identification and functional enrichment of differential expressed hypoxia-related genes (HRGs) and lactate metabolism-related genes (LRGs) in HCC. (A) The volcano plot of the differentially expressed genes (DEGs) between normal and tumor tissues. (B) The heat map showed the detailed expression of the top 50 DEGs. (C) The Veen diagram of the DEGs, HRGs and LRGs. (D) The protein–protein interaction (PPI) network of differential expressed HRGs and LRGs. GO enrichment analysis (E) and KEGG pathway analysis (F) of differential expressed HRGs and LRGs.
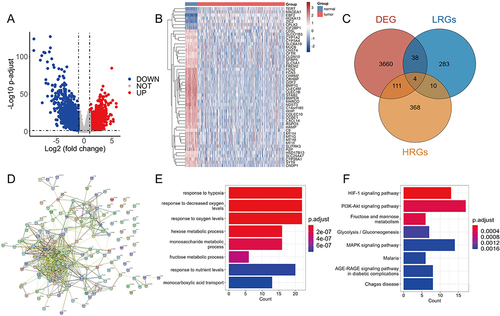
Figure 2 Identification and validation of the five differentially expressed hypoxia- and lactate metabolism-related genes (HLRGs). (A) Univariate Cox regression analysis of the differentially expressed hypoxia-related genes (DEHRGs) and differentially expressed lactate metabolism-related genes (DELRGs). (B) Tuning parameter (λ) selection in LASSO model. (C) The LASSO coefficient profile of 14 prognostic DEHRGs and DELRGs. (D) The results of stepwise multivariate Cox regression analysis of HLRGs were shown by forest graph. (E) Differential expression of the five HLRGs between the HCC and normal tissues in TCGA and GTEx databases. (F) The expression levels of the five HLRGs in 14 pairs HCC and matched adjacent normal tissues were examined by qRT-PCR. (G) Kaplan-Meier survival analysis of patients with different expression of five selected HLRGs. (H) The expression levels of five HLRGs in patients at different stages. (I) Immunohistochemical staining for four HLRGs in the normal liver and HCC tissues. *p < 0.05; **p < 0.01; ****p < 0.0001.
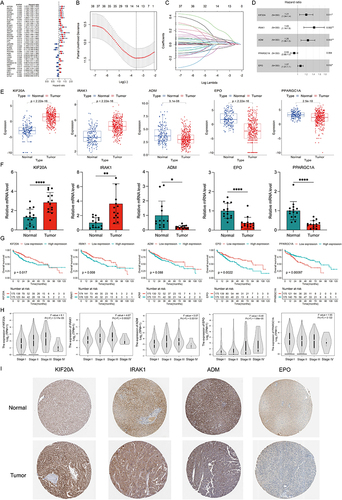
Figure 3 Evaluation and validation of the hypoxia- and lactate metabolism-related prognostic model (HLPM). (A and B) Kaplan-Meier survival analysis of two risk groups in the TCGA-LIHC cohort and ICGC-LIRI-JP cohort. (C and D) Receiver operating characteristic (ROC) curve verified the prognostic value of the HLPM in the TCGA-LIHC cohort and ICGC-LIRI-JP cohort. (E and F) Distribution of risk score, survival time and survival status of patients, and expression of the five HLRGs in the TCGA-LIHC cohort and ICGC-LIRI-JP cohort.
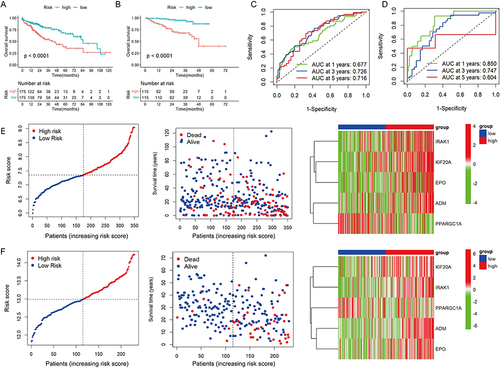
Figure 4 Functional enrichment and mutation analysis of two risk groups in TCGA-LIHC cohort. (A) The volcano plot of the differentially expressed genes (DEGs) between high- and low-risk groups. (B) The heat map showed the detailed expression of the top 50 DEGs. GO-based GSEA enrichment analysis in high-risk (C) and low-risk (D) groups. The pathways enriched in the high-risk (E) and low-risk (F) groups according to GSEA analysis in KEGG database. (G) The relationship between the risk score and tumor mutation burden (TMB). Mutation profile in high-risk (H) and low-risk (I) groups.
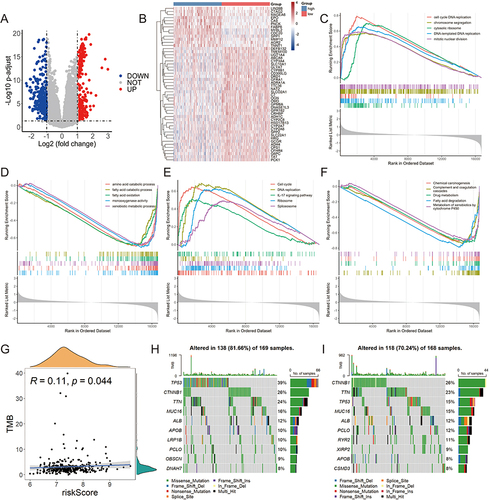
Figure 5 Different immune landscapes of the two risk groups in TCGA-LIHC cohort. (A) The expression of immune checkpoint genes (ICGs) (HAVCR2, TIGIT, PDCD1, LAG3 and CTLA4) in high- and low-risk groups. (B) The correlation between levels of ICGs and risk score. (C) The expression of chemokines and receptors in two risk groups. (D) The infiltration fractions of immune cells in two risk groups. (E) The correlation between the infiltration of immune cells and the five HLRGs. TPM, transcripts per million; *p < 0.05; **p < 0.01; ***p < 0.001.
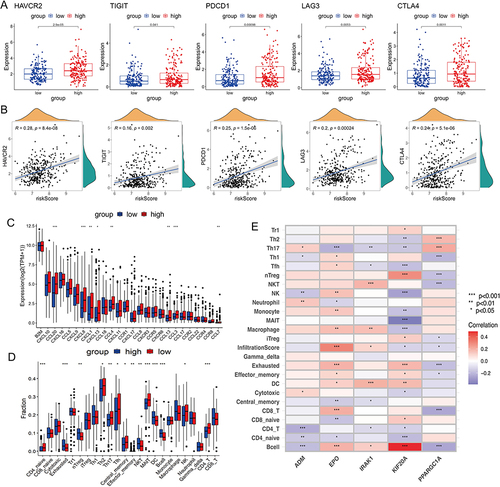
Figure 6 The assessment of the response to immunotherapy. (A) Differences in TIDE scores between high- and low-risk groups in TCGA-LIHC cohort. (B) Differences in risk scores between the responders and non-responders in TCGA-LIHC cohort. (C) The proportion of patients with response to immunotherapy in two risk groups in TCGA-LIHC cohort. (D) Kaplan-Meier analysis of two risk groups in GSE78220 cohort. (E) Comparison of the risk scores between the responders and non-responders in GSE78220 cohort. (F) The proportion of patients with response to anti-PD-1 immunotherapy in two risk groups in GSE78220 cohort.
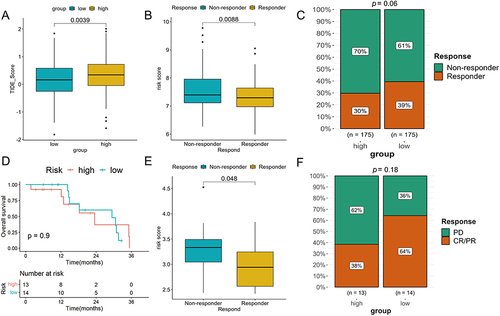
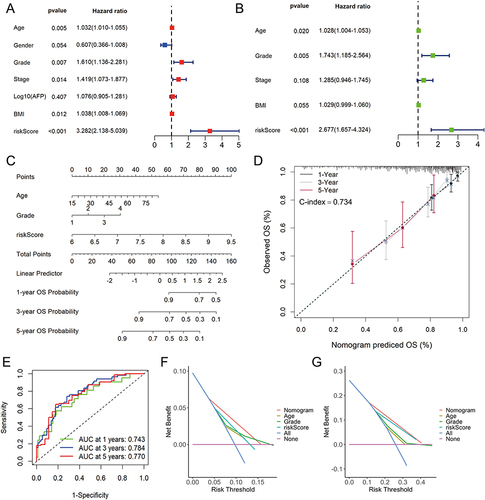
Figure 7 Construction and evaluation of nomogram in TCGA-LIHC cohort. The univariate (A) and multivariate (B) Cox regression analysis for risk score and other clinic characteristics. (C) The nomogram for predicting 1-, 3-, and 5-years overall survival (OS) by risk score, age and grade. (D) Calibration curves of the nomogram to predict 1-, 3- and 5-year OS probabilities. (E) Receiver operating characteristic (ROC) curves of the nomogram. Decision curve analysis (DCA) of the nomogram and other clinical characteristics at 1- (F) and 3-year (G) indicated the net clinical benefits.