Figures & data
Table 1 Clinical Characteristics of BLDs and HCC in the Training and Independent Internal Validation Cohorts
Table 2 The Univariate and Multivariate Logistic Regression Analysis for Distinguishing HCC from BLDs Based on Clinical Laboratory Index
Figure 1 The three nomogram algorithms (LAD, C-GALAD and TAGALAD) to estimate the risk of HCC. Univariate and multivariate analyses identified AFP, AFP-L3, DCP, TBIL, and ALB as significant risk factors independently associated with HCC. Utilizing these factors, we developed HCC risk estimation nomograms: LAD (A), C-GALAD (B), and TAGALAD (C). To apply a nomogram, locate each indicator on its axis, assign points, sum these points, and then determine the HCC probability at the bottom of the nomogram based on the total points.
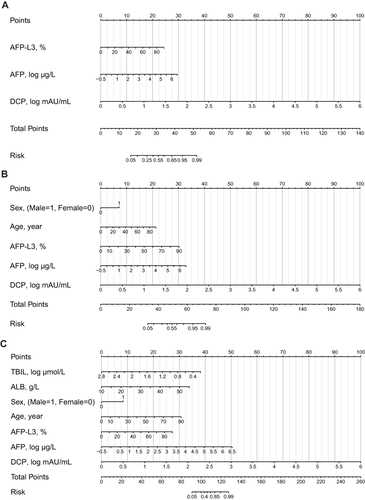
Table 3 Comparison Among the Four Nomograms and the Individual HCC Biomarker in the Training Cohort
Figure 2 The ROC curve analyses of GALAD, LAD, C-GALAD, TAGALAD and individual tumor marker in training and validation cohorts. (A–D) Training cohort: The AUC analysis showed the diagnostic efficacy of the three nomograms for HCC and BLDs (A) (LAD: AUC: 0.943, 95% CI: 0.938–0.948; C-GALAD: AUC: 0.952, 95% CI: 0.947–0.956; TAGALAD: AUC:0.969, 95% CI: 0.965–0.973) better than GALAD (AUC: 0.925, 95% CI: 0.919–0.931) and individual tumor markers (AFP: AUC: 0.828, 95% CI: 0.819–0.836; DCP: AUC: 0.919, 95% CI: 0.913–0.925; AFP-L3: 0.764, 95% CI: 0.755–0.774). In the subgroup analysis of HCC vs LC (B), HBV-HCC vs CHB (C) and HCC vs BLDs (both without HBV infection) (D), the diagnostic algorithm still achieved excellent diagnostic performance, with AUCs exceeding 0.900. (E–G) Internal validation cohort: The AUC revealed that the nomograms (LAD: AUC: 0.905, 95% CI: 0.892–0.917; C-GALAD: AUC: 0.908, 95% CI: 0.895–0.919; TAGALAD: AUC: 0.964, 95% CI: 0.956–0.972) showed the best diagnostic power for HCC vs BLDs (E) in the internal validation cohort (AFP: AUC: 0.763, 95% CI: 0.745–0.780; DCP: 0.894, 95% CI: 0.881–0.906; AFP-L3: AUC: 0.724, 95% CI: 0.705–0.742; GALAD: AUC: 0.866, 95% CI: 0.851–0.879). Similarly, in the subgroup analyses of HBV-HCC vs CHB (F) and HCC vs BLDs (both without HBV infection) (G) in the internal validation cohort, the diagnostic algorithms continued to show excellent performance, with all AUCs exceeding 0.900. (H) External validation cohort: For the external validation cohort, the nomograms (LAD: AUC: 0.892, 95% CI: 0.853–0.931; C-GALAD: AUC: 0.912, 95% CI: 0.878–0.945; TAGALAD: AUC: 0.931, 95% CI: 0.895–0.958) again demonstrated ideal efficacy in distinguishing HCC from BLDs, and were superior to AFP (AUC: 0.769, 95% CI: 0.713–0.825, P<0.001), DCP (AUC: 0.840, 95% CI: 0.792–0.887, P<0.001) and AFP-L3 (AUC: 0.752. 95% CI: 0.698–0.806. P<0.001).
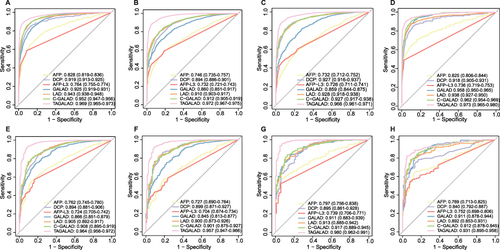
Figure 3 Performances of three nomograms in predicting OS and RFS in the follow-up cohort. (A and B) LAD algorithm: In HCC prognostic evaluation using the LAD model, patients with scores over 58.17 showed median OS (A) and RFS (B) of 27.83±14.05 and 27.25±14.02 months, respectively, which were about 5 months less than those with lower scores (OS: 33.38±11.85, RFS: 32.83±12.12 months). (C and D) C-GALAD algorithm: In HCC prognosis using C-GALAD, high-risk patients (scores > 78.10) had OS (C) and RFS (D) of 27.32±14.16 and 26.74±14.11 months, respectively. The low-risk group showed longer OS (33.90±11.44 months) and RFS (33.36±11.75 months). (E and F) TAGALAD algorithm: Using 139.36 as the median cutoff in the TAGALAD model, the high-risk group’s OS (E) and RFS (F) were 28.31±14.18 and 27.73±14.17 months, respectively, about 4.58 and 4.62 months less than the low-risk group’s OS (32.89±11.91) and RFS (32.35±12.15). (G and H) Cox regression forest plot: Cox regression revealed LAD, C-GALAD, and TAGALAD were HCC independent predictors of survival (LAD HR: 1.018; C-GALAD HR: 1.016; TAGALAD HR: 1.015) (G) and recurrence (LAD HR: 1.020; C-GALAD HR: 1.017; TAGALAD HR: 1.017) (all P-values <0.05) (H).
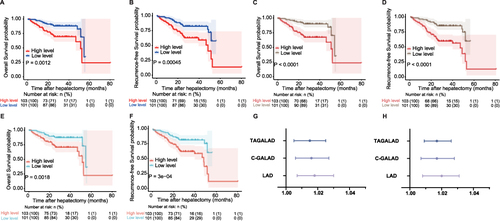
Table 4 Comparison Among the Four Nomograms and the Individual HCC Biomarker in the Prospective Study Cohort
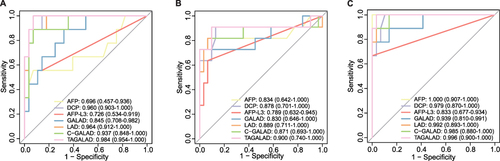
Figure 4 The diagnostic efficacies of AFP, AFP-L3, DCP, GALAD, LAD, C-GALAD and TAGALAD in distinguishing the very early-stage HCC from the matched controls at corresponding time points. (A) At week −48, the AUCs of TAGALAD, LAD, C-GALAD, and GALAD were 0.984, 0.964, 0.937, and 0.845 respectively, in descending order. (B) At week −24, AUCs were 0.900 for TAGALAD, 0.889 for LAD, 0.871 for C-GALAD, and 0.830 for GALAD. TAGALAD was the most effective one among these four diagnostic models. (C) At week 0, the best AUC was shown in TAGALAD (0.996), then was the LAD (0.992), the C-GALAD (0.985) and the GALAD (0.939).