Figures & data
Box 1 Eligibility Criteria
Figure 1 Characteristics of the eligible studies. (A) Types of specimen grossly examined. (B) Boxplot representing the distribution of sample size. (C) Endpoints investigated. (D) Types of macroscopic variables analyzed.
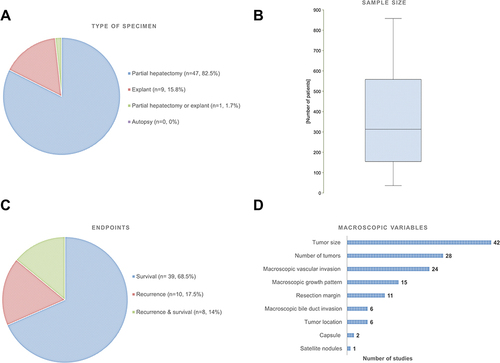
Figure 2 Associations between macroscopic features and recurrence. (A) Forest plot illustrating the association of tumor size with recurrence. *Size was analyzed as a dichotomized variable ªDetailed results not provided. (B) Forest plot illustrating the association of number of nodules with recurrence. ªComparison of 2 vs 1 nodule *Detailed results not provided. (C) Forest plot illustrating the association of macroscopic vascular invasion with recurrence.
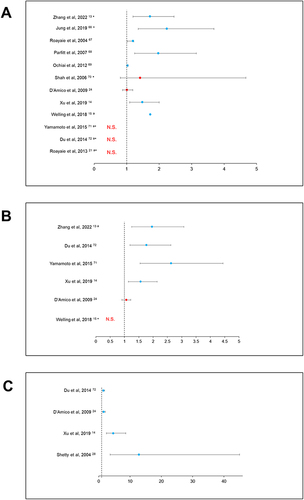
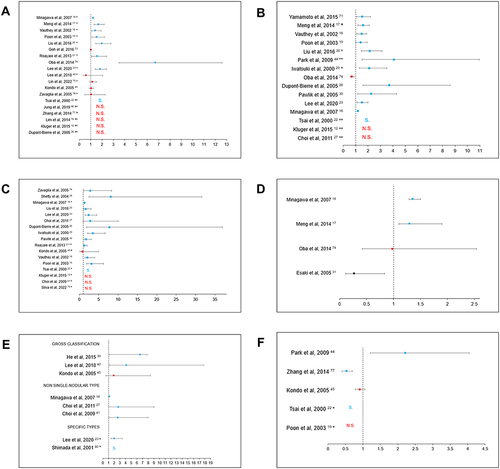
Figure 3 Associations between macroscopic features and overall survival (OS). (A) Forest plot illustrating the association of tumor size with OS. *Size was analyzed as a dichotomized variable. ªDetailed results not provided. (B) Forest plot illustrating the association of number of nodules with OS. ªNoN ≥ 2°NoN ≤ 3 °°NoN > 3 *NoN 1–2 vs 3–4. **Detailed results not provided. (C) Forest plot illustrating the association of macroscopic vascular invasion with OS. °Vascular or bile duct invasion.°°Extent to hepatic vein or inferior vena cava. ªInvasion along portal vein system.*Detailed results not provided. (D) Forest plot illustrating the association of macroscopic bile duct invasion with OS. (E) Forest plot illustrating the association of macroscopic growth pattern with OS. *Association between infiltrative type and OS. °Association between single-nodular with extra-nodular growth and OS (detailed results not provided). (F) Forest plot illustrating the association of resection margin with OS. *Detailed results not provided.