Figures & data
Table 1 The Sequences of RAD21 siRNA and qRT-PCR Primer
Figure 1 Screening of key transcriptional regulators of incomplete ablation residual HCC. (A) Volcano plot displaying differentially expressed genes in residual cancer tissue of MHCC97-H. (B) Volcano plot illustrating differentially expressed genes in residual cancer tissue of HepG2. (C) Overlapping Venn diagram showing upregulated genes and transcriptional regulatory factors based on HCC, HepG2 residual cancer, and MHCC97-H residual cancer. (D) Cox survival regression analysis of the OSrate in HCC patients. (E) Cox survival regression analysis of progression-free survival rate in HCC patients.
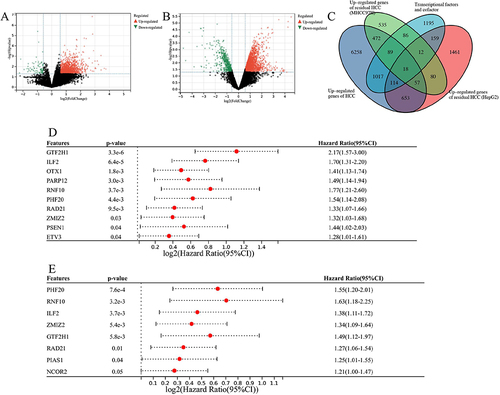
Figure 2 The expression pattern of RAD21 mRNA in a single data set was analyzed by globally multicentric microarrays and bulk RNA-seq data.
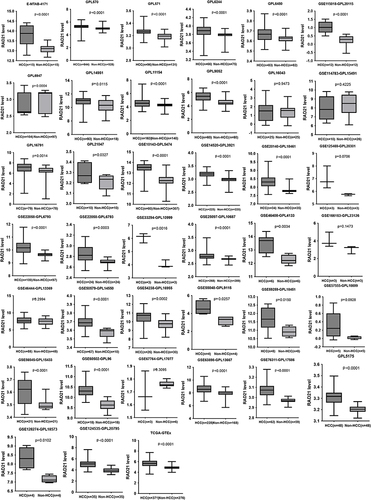
Figure 3 The expression pattern of RAD21 in liver cancer. (A) The random forest plot illustrates a significant overexpression of RAD21 in HCC. (B-E) Single-cell sequencing analysis reveals that RAD21 expression is primarily distributed in tumor cells. (E) Proteomics analysis demonstrates significantly higher levels of RAD21 protein in HCC compared to adjacent normal tissue. (F and G) The RAD21 staining in HCC tissues was observed under the microscope (x40, x100). (H and I) The RAD21 staining in HCC and liver tissues was observed under the microscope (x40, x100).
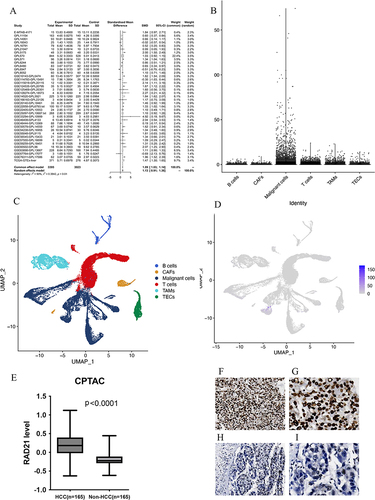
Table 2 Immunohistochemistry Shows the Expression of RAD21 in HCC and Adjacent Cancer and Its Relationship with Clinicopathological Parameters
Table 3 The Relationship Exploration Based on Transcriptomics Between RAD21 Expression and HCC Clinicopathological Parameters
Table 4 The Relationship Exploration Based on the Proteomics Between RAD21 Protein Expression and HCC Clinicopathological Parameters
Figure 4 Diagnostic and survival significance of RAD21 in HCC. The sROC curves. (A) The value of RAD21 in distinguishing HCC and non-tumor livers; an indication of OS (B) and PFS (C) based on RAD21 mRNA levels in HCC based on RNA-seq data; an indication of OS (D) and PFS (E) based on RAD21 protein levels in HCC using proteomics data.
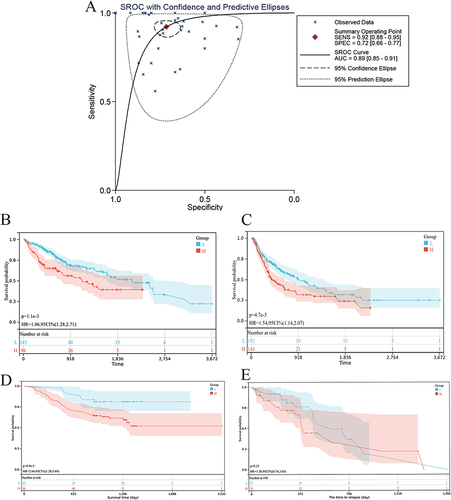
Figure 5 RAD21 level related to the inhibitory immune checkpoints and ICB response. (A) The expression of CD274, CTLA4, HAVCR2, PDCD1, and TIGIT is relatively increased in the high expression group of RAD21. (B) TIDE scores predict a low potential response to immunotherapy in the RAD21 highly expressed group. Note: * indicates p< 0.05, *** indicates p< 0.001, and **** indicates p< 0.0001.
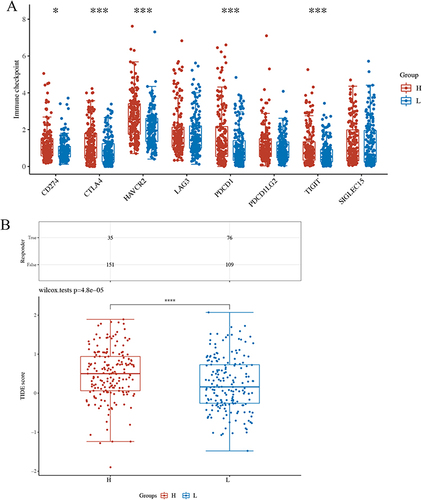
Figure 6 RAD21 mRNA and protein levels after liver cancer cells transfected with siRNA. RAD21 mRNA levels in Huh7 (A) and Hep3B (D) cells after siRNA transfection; RAD21 protein levels in Huh7 (B and C) and Hep3B (E and F) cells after siRNA transfection. Note: *** indicates p< 0.001, and **** indicates p< 0.0001.
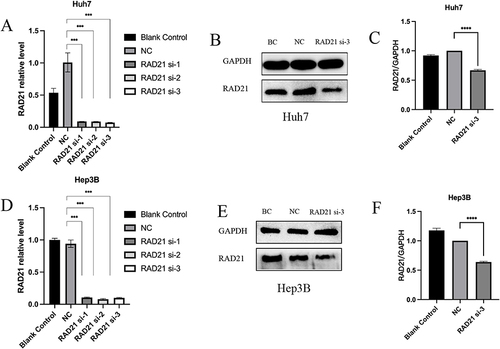
Figure 7 Effect of RAD21 knockdown on migration and proliferation of liver cancer cells. Cell scratch assays detected a decreased migration capability of Hep3B (A and B) and Huh7 (D and E) cells after RAD21 knockdown; CCK-8 assays detected a decreased proliferation capability of Hep3B (C) and Huh7 (F) cells after RAD21 knockdown. Note: *** indicates p< 0.001, and **** indicates p< 0.0001.
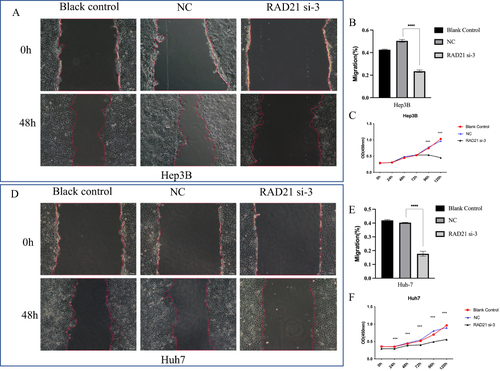
Figure 8 Effect of RAD21 knockdown on migration and invasion of liver cancer cells. Transwell migration and invasion assays detected decreased migration and invasion capabilities of Hep3B (A and B) and Huh7 (C and D) cells after RAD21 knockdown. Note: **** indicates p< 0.0001.
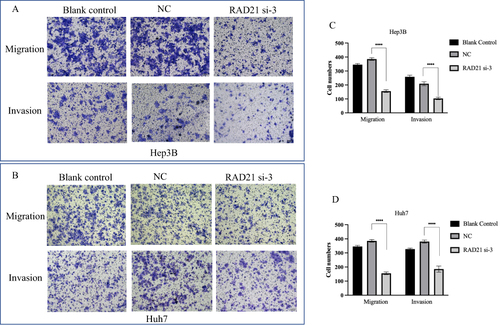
Figure 9 Alteration of RAD21 expression and biological behaviors in heat-treated liver cancer cells. Transwell assays detected enhanced migration and invasion capabilities of Hep3B (A and B) and Huh7 (D and E) cells after heat treatment; CCK-8 experiments detected increased proliferation capability of Hep3B (C) and Huh7 (F) cells after heat treatment; (G–J) RT-qPCR and WB detected increased RAD21 mRNA and protein in liver cancer cells after heat treatment. Note: ** indicates p< 0.01, *** indicates p< 0.001, and **** indicates p< 0.0001.
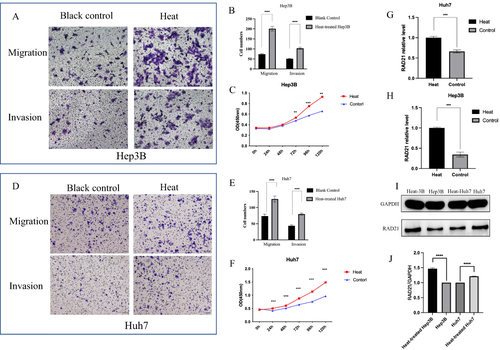
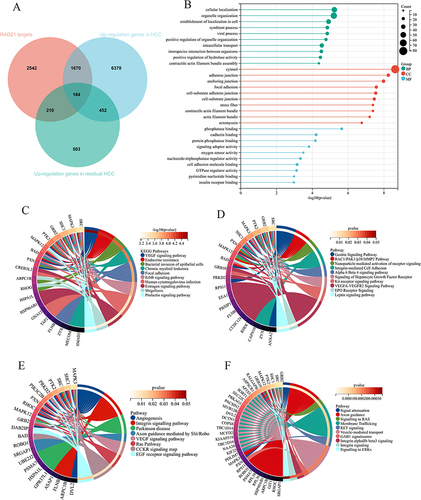
Figure 10 Downstream targets of RAD21 and Gene Ontology and KEGG pathway analysis in residual cancer. (A) Overlapped genes between RAD21 targets and upregulated genes in residual HCC and HCC. Gene Ontology (B), KEGG (C), WikiPathways (D), Panther (E), and Reactome (F) pathway analysis for the targets of overlapped genes.