Figures & data
Table 1 Primer Sequence Used in This Study
Figure 1 LncRNA MEG3 is engaged in the process of macrophage polarization. BMDMs were treated with 10 ng/mL LPS/IFNγ or IL4/IL13 for 48 h. (A) To assess M1 phenotype polarization after LPS/IFNγ treatment, flow cytometry was performed to calculate the percentage of F4/80+CD68+ cells in BMDMs. (B) Relative MEG3 level in LPS/IFNγ-treated BMDMs was quantified by RT-qPCR analysis. (C) To evaluate M2-like polarization of BMDMs after IL4/IL13 stimulation, the proportion of F4/80+CD206+ cells was analyzed using flow cytometry. (D) RT-qPCR was conducted to measure MEG3 expression in IL4/IL13-stimulated BMDMs. (E and F) MEG3 distribution and expression in LPS/IFNγ-treated BMDMs at 0, 48, and 72 h were tested by FISH. (G and H) At the three timepoints, MEG3 level in IL4/IL13-treated BMDMs was detected by FISH. **p<0.01.
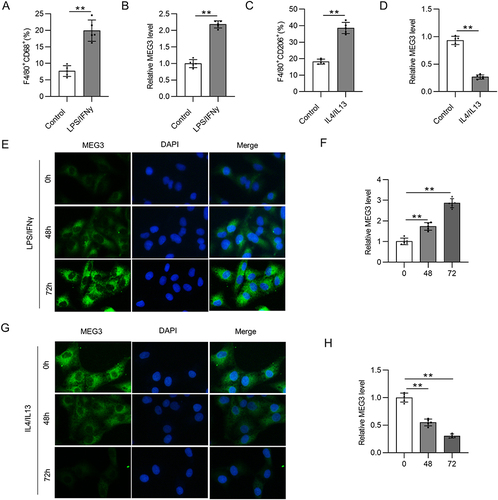
Figure 2 Overexpressed lncRNA MEG3 suppresses M2 macrophage polarization. BMDMs were transfected with Adv-MEG3/Adv-NC and treated with IL4/IL-13 to induce M2 polarization at the same time. (A) PCR analysis was performed to measure the overexpression efficiency of Adv-MEG3. (B and C) To evaluate M2 polarization, F4/80+CD206+ cell percentage was measured using flow cytometry analysis. (D–F) The mRNA levels of M2 polarization markers (ARG1, CD163, and CD206) in BMDMs were quantified by RT-qPCR. **p<0.01.
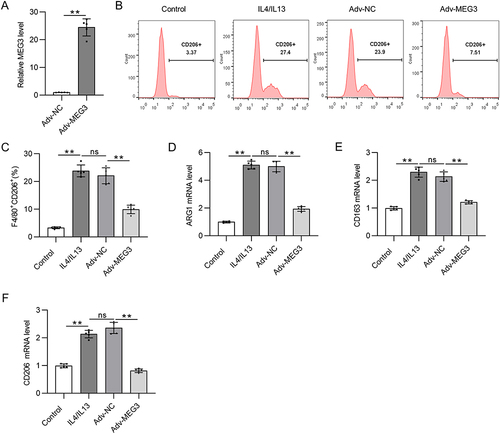
Figure 3 LncRNA MEG3 promotes M1 macrophage polarization. To induce M1 polarization, LPS/IFNγ was utilized to treat BMDMs. At the same time, BMDMs were transfected with Adv-sh-MEG3 or Adv-sh-NC to explore the impact of MEG3 on M1-like polarization. (A) The knockdown efficiency of Adv-sh-MEG3 in M1-phenotype BMDMs was tested by RT-qPCR. (B and C) To assess M1 macrophage polarization, flow cytometry was conducted to measure F4/80+CD68+ cell proportion. (D–F) The mRNA levels of M1 polarization markers (IL-1, CD68, and iNOS) in BMDMs of indicated groups were measured by PCR. **p<0.01.
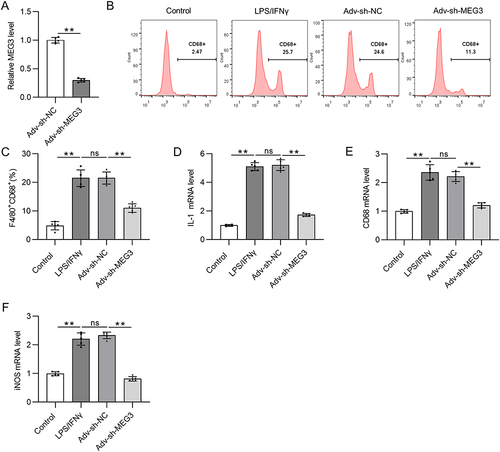
Figure 4 LncRNA MEG3 binds to HuR in BMDMs with M1 or M2 phenotype. (A) The potential RBPs regulated by lncRNA MEG3 were predicted using starBase database. ELAVL1 (also known as HuR) was identified. (B) RNA pulldown assay and Western blot were performed to validate the combination between HuR and MEG3 in BMDMs treated with IL4/IL13 (M2 phenotype) or LPS/IFNγ (M1 phenotype). (C) PCR was performed to measure the mRNA expression of HuR in M1 and M2 macrophages transfected with Adv-NC and Adv-MEG3. (D) HuR protein expression in Adv-NC and Adv-MEG3 groups was quantified by Western blot. **p<0.01.
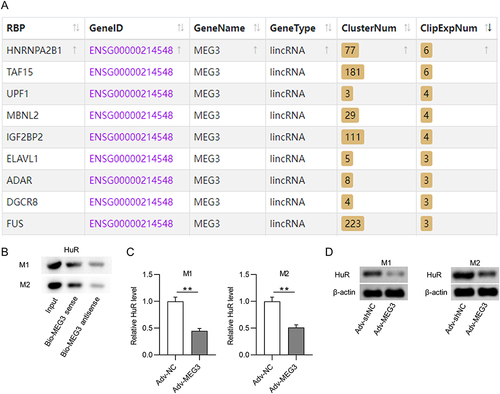
Figure 5 HuR reduces CCL5 expression by inhibiting CCL5 transcription. (A and B) PCR and Western blot were conducted to measure the knockdown efficacy of HuR in BMDMs treated with IL4/IL13 or LPS/IFNγ. (C) The effect of HuR depletion on CCL5 mRNA expression in M1 or M2 macrophages was measured by PCR. (D) The influence of HuR deficiency on CCL5 stability was evaluated by actD treatment. (E) Luciferase reporter assays were performed to detect the impact of HuR knockdown on the activity of CCL5 promoter. *p<0.05, ***p<0.001.
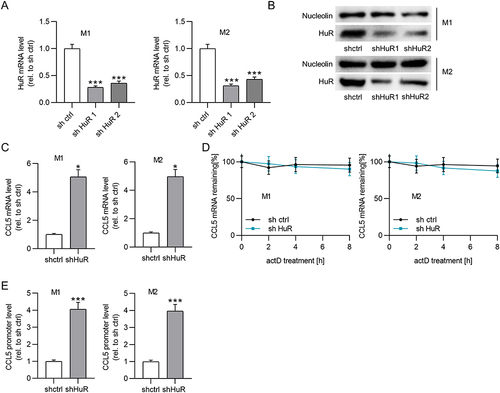
Figure 6 Upregulation of lncRNA MEG3 suppresses cell metastasis and angiogenesis by inhibiting macrophage M2 polarization. Conditioned medium from BMDMs was used to culture Huh-7 cells for 24 h. (A–D) Cell migration and invasiveness in control group, IL4/IL13 group, IL4/IL13 + Adv-NC group, and IL4/IL13 + Adv-MEG3 group were measured by Transwell assays. (E and F) Tube formation assays were conducted to evaluate angiogenesis in indicated groups, and formed tubes were quantified. **p<0.01.
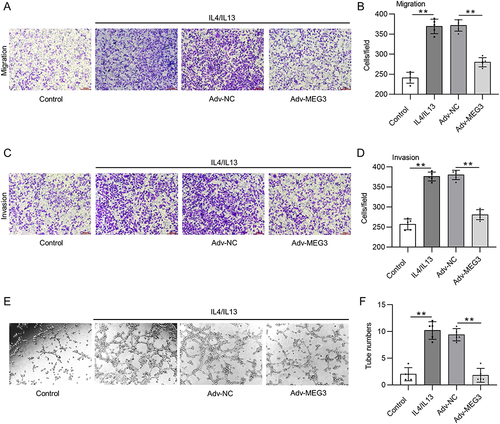
Figure 7 LncRNA MEG3 inhibits tumorigenesis in vivo. Huh-7 cells and BMDMs transfected with Adv-MEG3/Adv-NC were subcutaneously planted into the armpits of mice. Thirty days later, mice were sacrificed. (A) An image is provided to show the size of harvested tumors in Huh-7 group, Huh-7 + BMDMs + Adv-NC group, and Huh-7 + BMDMs + Adv-MEG group. (B and C) Tumor weight and body weight in each group were compared. (D and E) Immunofluorescent staining was performed to detect CD206 and CD68 expression in tumor tissues of each group. (F) The mRNA levels of M2 polarization markers were quantified by RT-qPCR. (G) RT-qPCR was performed to analyze the mRNA levels of M1 polarization markers in tumor tissues. **p<0.01. ns: not significant.
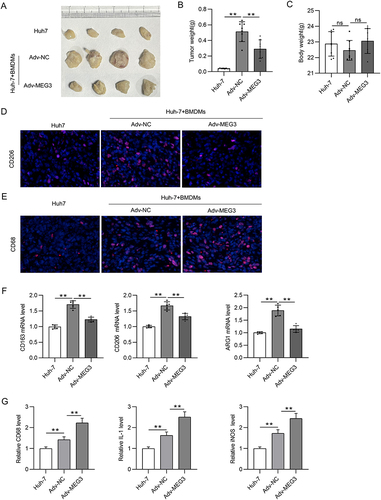
Figure 8 CCL5 depletion reverses the suppressive effect of Adv-MEG3 on HCC malignant cell behavior. (A–C) RT-qPCR and Western blot were conducted to quantify CCL5 mRNA and protein levels in M2-like macrophages transfected with Adv-shCCL5 or Adv-shNC. (D–G) Transwell assays were carried out for measurement of cell migration and invasion in Adv-NC, Adv-MEG3, and Adv-MEG3+ Adv-shCCL5 groups. (H and I) Tube formation assays were conducted to explore the influence of MEG3 and/or CCL5 on angiogenesis in the context of M2-like macrophage polarization. *p<0.05, **p<0.01.
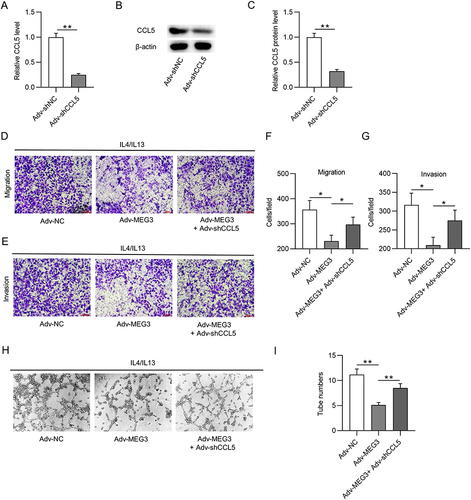
Figure 9 The predictive values of MEG3, HuR, and CCL5 in HCC. (A) MEG3 expression in LIHC tissues and normal samples was predicted with GEPIA. (B) ELAVL1 (HuR) expression in LIHC tissues and normal samples was analyzed in the starBase database. (C) The correlation between MEG3 expression and CCL5 expression in LIHC tissues was predicted by GEPIA. (D–F) The influence of MEG3, ELAVL1, or CCL5 on the prognosis of LIHC patients was evaluated by Kaplan-Meier Plotter analysis. *p<0.05.
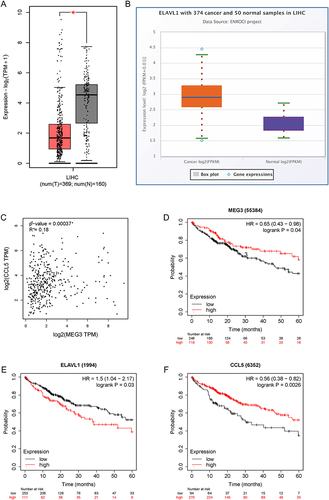
Figure 10 Expression and correlation verification of MEG3, HuR, and CCL5 in HCC samples. (A–C) RT-qPCR was performed to measure MEG3, HuR, and CCL5 expression in HCC samples (n=32) and non-tumor samples (n=32). (D–F) Spearman correlation analysis was performed to analyze the expression correlation between MEG3 and HuR (D), that between HuR and CCL5 (E), and that between MEG3 and CCL5 (F). ***p<0.001.
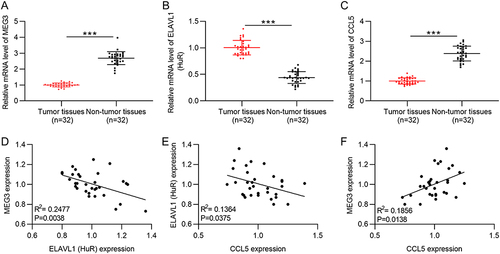
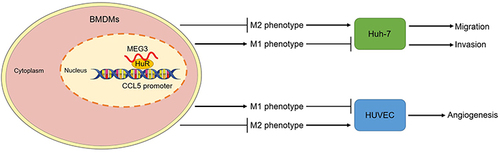
Figure 11 LncRNA MEG3 inhibits HCC malignant cell behavior by regulating M1 and M2 macrophage polarization via binding to HuR and upregulation of CCL5. A diagram was provided to elucidate how MEG3 regulates HCC malignant cell behavior by regulating HuR and CCL5 in nucleus of BMDMs with M1- or M2-like polarization.