Figures & data
Figure 1 Genetic alterations and expression features of ICDRGs in TCGA-LIHC. (A)The flowchart of the entire study. (B) The mutation frequency of 33 ICDRGs in 371 HCC patients from TCGA. (C) CNV frequency of ICDRGs in TCGA-LIHC cohort. The height of the column represents the alteration frequency. The green dot represents deletion frequency. The red dot represents the amplification frequency. (D) Spearman correlations between ICDRGs. (E) Differences in mRNA expression levels of ICDRGs in normal and tumor samples.*P < 0.05; **P < 0.01; ***P < 0.001; ns, no significance.
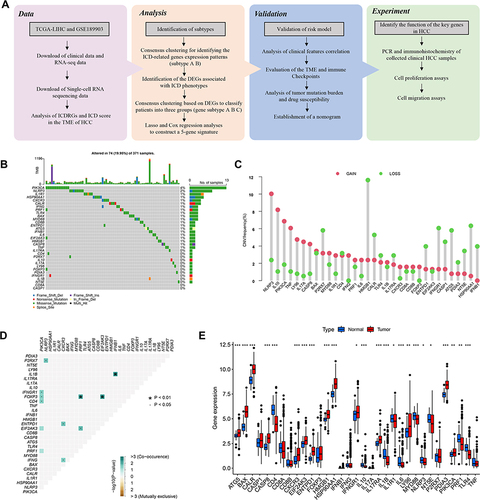
Figure 2 Identification of ICD-related gene subtypes in HCC. (A) Consensus clustering of HCC patients with k=2. (B) Kaplan-Meier curve showing the survival advantage of the ICD-low subtype was considerably better. (C) Heatmap displaying the association between the two subtypes and clinicopathological factors. (D) The immune score between two subtypes. (E) The landscape of tumor-infiltrating immune cells was analyzed by ssGSEA. Box plots revealing differential expression of HLA genes (F) and multiple ICGs (G) between two subtypes. (H) Violin plots revealing the ESTIMATE score, stroma score, and tumor purity in two subtypes. *P < 0.05; **P < 0.01; ***P < 0.001; ns, no significance.
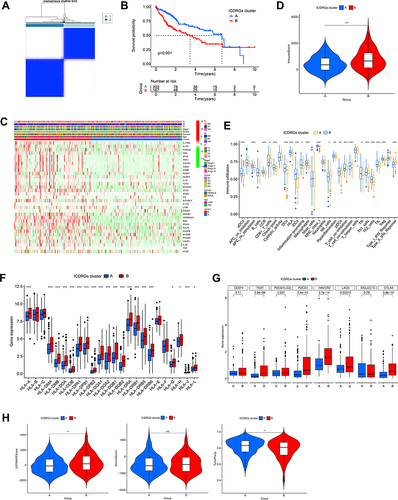
Figure 3 Associations between the DEG-based genotypes and tumor immune cell infiltration (A) Consensus clustering of HCC patients with k = 3. (B) The survival curve showed patients in gene cluster B exhibited higher OS(p < 0.001). (C) The immune score were analyzed by ssGSEA in three gene clusters. (D) Variations in clinical factors among patients of the three gene clusters, with fustat, age, gender, tumor grade, and stage as reference indicators. (E) Expression profile of 33 ICDRGs in three gene clusters. (F) The population of tumor-infiltrating immune cells was analyzed by ssGSEA in three gene clusters. Box plots indicating the difference of HLA genes (G) and multiple ICGs (H) between three gene clusters. (I) Violin plots showing the differences in ESTIMATE score, stromal score, and tumor purity between three gene clusters. *P < 0.05; **P < 0.01; ***P < 0.001; ****P < 0.0001;ns, no significance.
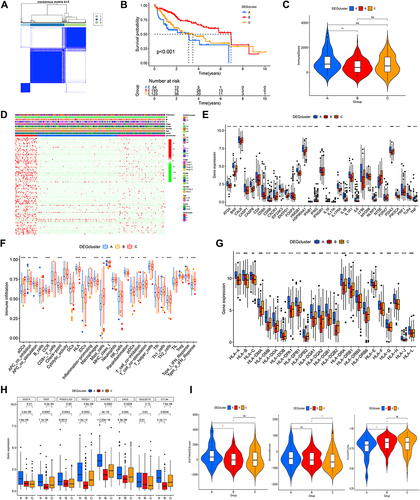
Figure 4 ICD-related prognostic signature generation and validation. (A-C) Lasso-Cox analysis of survival-related DEGs to identify five risk genes and construct the ICD-related prognostic model. Survival curves of different risk groups in TCGA cohort (D), TCGA training cohort (E), TCGA-testing cohort (F), and GEO validating cohort GSE76427 (G). (H) ROC curves in four datasets to estimate 1-, 3-, and 5-year survival. (I) Heatmaps of the 5 ICD-related gene signatures in the four datasets. (J, K) Distribution and scatterplot of risk scores in the four datasets.
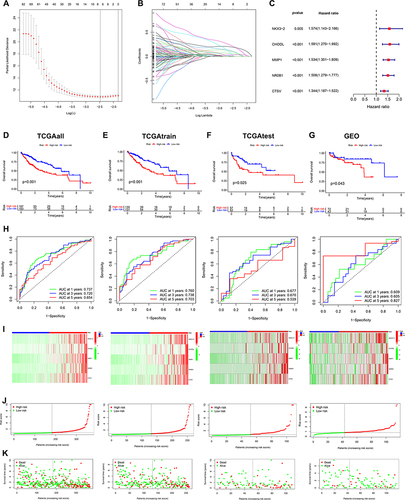
Figure 5 Relationship of ICD-related gene signature with the TME. (A) The infiltration abundance of immune cells in two risk groups. (B) The difference in immune functions between the two risk groups. (C) The stromal score, immune score, and ESTIMATE score between the two risk groups. (D) Heat map revealing the relationship between the 5 ICD genes, risk score, and immune cells and immune function. (E)Heatmap indicating the relationship between ICGs and 5 ICD genes, and risk scores. (F)The connection between stromal and immune cells and risk score was determined by seven different algorithms. *P < 0.05; **P < 0.01; ***P < 0.001; ns, no significance.
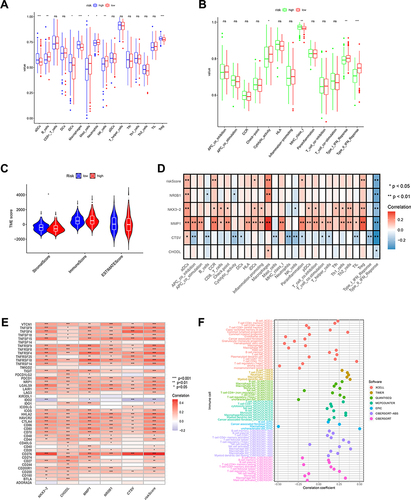
Figure 6 Analysis of TMB and drug susceptibility. (A, B) Mutations in high- and low-risk populations are summarized via a waterfall plot. (C)TMB variation between the two risk groups. (D) Relationship between the risk score and TMB. (E and F) The KM curve of the tumor mutation burden versus the OS. (G)Difference of immunotherapy response with CTLA4- and PD-1-, CTLA4- and PD-1+, CTLA4+ and PD-1, and CTLA4+ and PD-1+ between two risk groups. (H)Prediction of the drug sensitivity (IC50) of 5-Fluorouracil, Afatinib, Bortezomib, Cediranib, Lapatinib, Dasatinib, lapatinib, and Crizotinib.
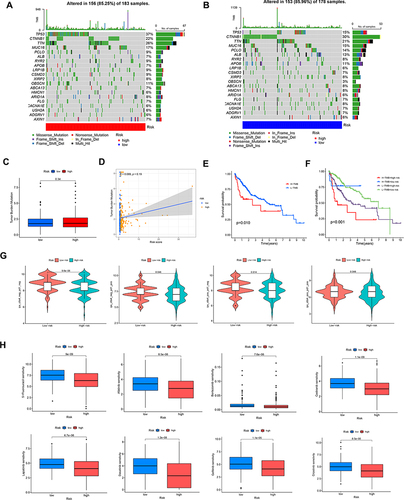
Figure 7 Analysis of clinical correlation and development of a nomogram. (A) The univariate Cox regression analysis and(B) multivariate Cox regression analysis of prognostic factors. (C) Heatmap for differential clinicopathological features of two risk groups. (D) ROC curves of the nomogram, risk, stage, and age for estimating 1-year OS of HCC. (E) Development of a nomogram based on risk, gender, age grade, and stage. (F) ROC curves of the nomogram, risk, stage, and age in predicting 3-year OS of HCC. (G) Calibration curves. (H) ROC curves of the age, risk, stage, and nomogram for estimating 5-year OS of HCC.
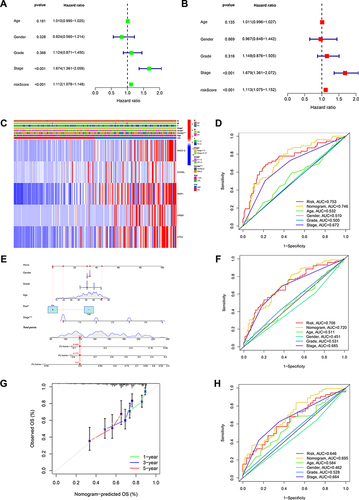
Figure 8 NKX3-2 exhibited amplification in HCC specimens and silencing NKX3-2 decreased the proliferation and migration of HCC cells. (A) NKX3-2 mRNA expression in tumor and adjacent normal tissues. (B) Representative images and staining scores of the IHC assay (scale bars: 50μm). (C) qRT-PCR showed NKX3-2 was up-regulated in HepG2, HCCLM3 and Hep3B HCC cells than in THLE-2 cells. (D) HCCLM3 cells and (E) HepG2 cells were transfected with siNKX3-2 for 48h and qRT-PCR detected the knockdown efficiency. (F) After NKX3-2 knockdown, the cloning ability of HCCLM3 and HepG2 cells decreased. (G) Wound healing experiments showing the migration ability of HCCLM3 and HepG2 cells was inhibited after NKX3-2 knockdown (scale bars: 200 μm;). CCK8 assays showing the proliferation of HCCLM3 (H) and HepG2 (I) cells was inhibited after NKX3-2 knockdown. (J) Transwell assays showing the invasion capability of HCCLM3 and HepG2 cells were suppressed after NKX3-2 silencing (scale bars: 100 μm;). **P < 0.01; ***P < 0.001; ****P < 0.0001; ns, no significance.
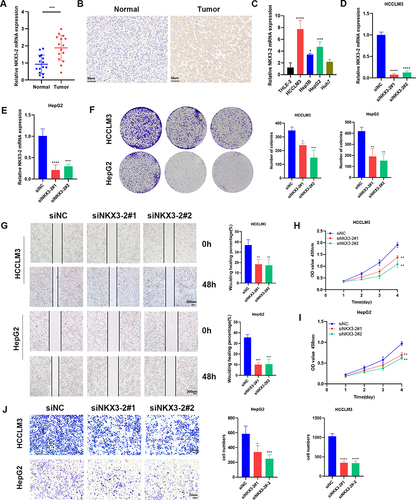
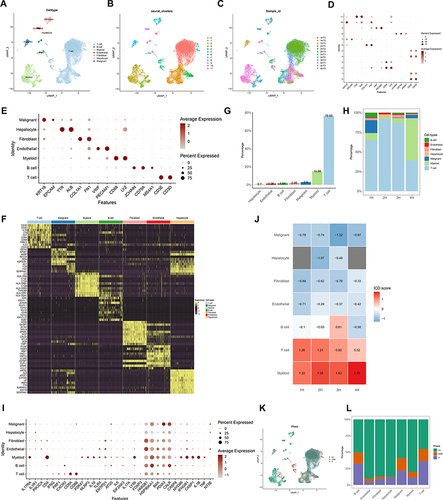
Figure 9 Correlation of ICDRGs with immune TME in single-cell RNA data of HCC. (A–C) View UMAP plots by sample_id, seurat_clusters, and celltype. (D) View marker gene expression by defined cell type. (E) View marker genes expression in each cluster. (F) DEGs of different cell types. (G) The overall percentage of different cell types. (H) The relative percentage of content of each cell type in each HCC patient. (I) Dot plot plots showing ICDRGs expression in each cell type. (J) Heatmap showing ICD pathway scores for each cell type in 4 HCC samples. (K) View of UMAP plots by cell cycle (phase). (L) The relative proportion of cells at each cell cycle stage.