99
Views
0
CrossRef citations to date
0
Altmetric
ORIGINAL RESEARCH

A Retrospective Study on Predicting Recurrence of Intermediate-Stage Hepatocellular Carcinoma After Radical Therapy

ORCID Icon, ORCID Icon, , , , , , & ORCID Icon show all
Pages 51-64 | Received 13 Nov 2023, Accepted 05 Jan 2024, Published online: 11 Jan 2024

Figures & data

Figure 1 Flowchart of patient selection.

Abbreviation: BCLC, Barcelona Clinic Liver Cancer classification.
Figure 1 Flowchart of patient selection.

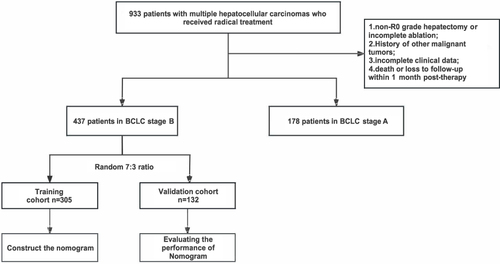
Table 1 Clinicopathologic Characteristics of Patients in Two Cohorts

Table 2 Univariate and multivariate analyses of prognostic factors based on RFS

Figure 2 Nomogram, including tumor diameter, number of tumors, number of involved liver segments, AFP, CA19-9, LDH, and SII, for two and three years RFS in stage B patients who received HR or RFA. The nomogram is valued to obtain the probability of 2-and 3-year recurrence by adding up the points identified on the points scale for each variable.

Abbreviations: AFP, alpha-fetoprotein; CA19-9, carbohydrate antigen 19–9; LDH, lactate dehydrogenase; SII, systemic immune inflammation index.
Figure 2 Nomogram, including tumor diameter, number of tumors, number of involved liver segments, AFP, CA19-9, LDH, and SII, for two and three years RFS in stage B patients who received HR or RFA. The nomogram is valued to obtain the probability of 2-and 3-year recurrence by adding up the points identified on the points scale for each variable.

Figure 3 (AD). Calibration curve of the nomogram in the training and validation cohort, with the x-axes are actual survival estimated by the nomogram, the y-axes are observed survival calculated by the Kaplan-Meier method. (A) 2-year recurrence in the training cohort. (B) 3-year recurrence in the training cohort. (C) 2-year recurrence in the validation cohort. (D) 3-year recurrence in the validation cohort.

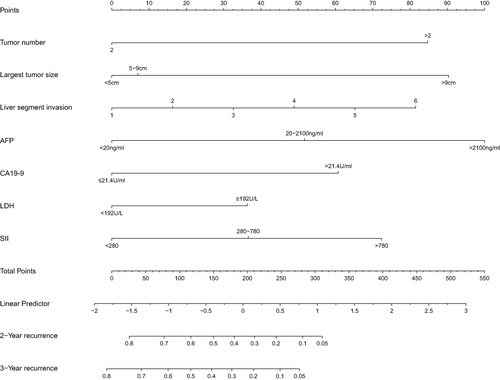
Figure 3 (A–D). Calibration curve of the nomogram in the training and validation cohort, with the x-axes are actual survival estimated by the nomogram, the y-axes are observed survival calculated by the Kaplan-Meier method. (A) 2-year recurrence in the training cohort. (B) 3-year recurrence in the training cohort. (C) 2-year recurrence in the validation cohort. (D) 3-year recurrence in the validation cohort.

Figure 4 (AD). ROC curve of the nomogram in the training and validation cohort. (A) The AUC for 2-year recurrence was 0.772 in the training cohort. (B) The AUC for 3-year recurrence was 0.790 in the training cohort. (C) The AUC for 2-year recurrence was 0.750 in the validation cohort. (D) The AUC for 3-year recurrence was 0.758 in the validation cohort.

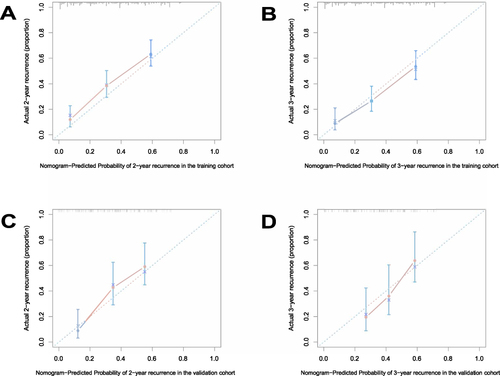
Figure 4 (A–D). ROC curve of the nomogram in the training and validation cohort. (A) The AUC for 2-year recurrence was 0.772 in the training cohort. (B) The AUC for 3-year recurrence was 0.790 in the training cohort. (C) The AUC for 2-year recurrence was 0.750 in the validation cohort. (D) The AUC for 3-year recurrence was 0.758 in the validation cohort.

Figure 5 (AC). (A) Time-dependent ROC curves of the nine models for predicting recurrence-free survival. (B) Decision curve analysis of the nine models for predicting 2-year recurrence in the training cohort. (C) Decision curve analysis of the nine models for predicting 3-year recurrence in the training cohort.

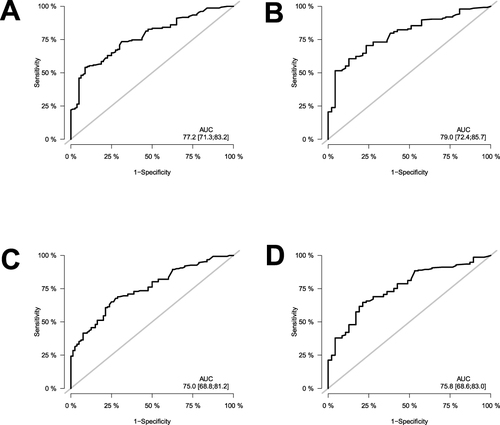
Figure 5 (A–C). (A) Time-dependent ROC curves of the nine models for predicting recurrence-free survival. (B) Decision curve analysis of the nine models for predicting 2-year recurrence in the training cohort. (C) Decision curve analysis of the nine models for predicting 3-year recurrence in the training cohort.

Figure 6 (AD). Kaplan-Meier RFS curves for subgroups of patients. Patients were stratified by the nomogram in the training cohort (A), validation cohort (B). Patients were stratified by the BCLC staging system in the stage (A) and stage B LRR group patients (C), stage (A) and stage (B) patients (D).

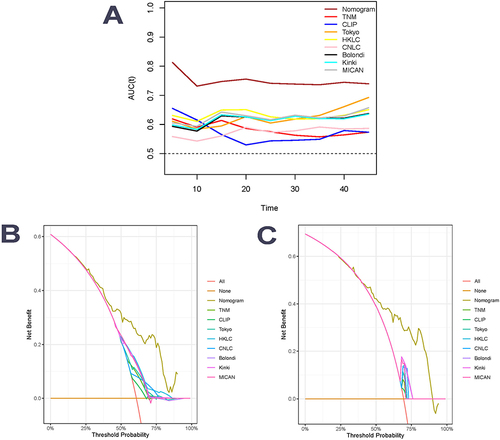
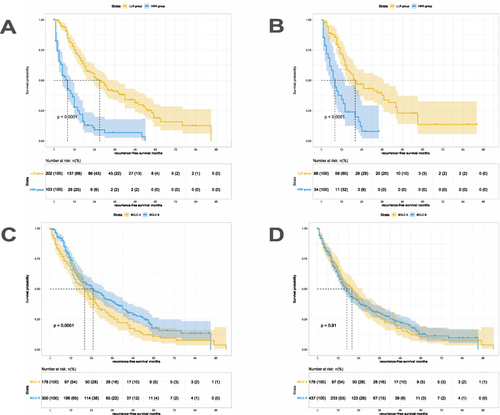
Figure 6 (A–D). Kaplan-Meier RFS curves for subgroups of patients. Patients were stratified by the nomogram in the training cohort (A), validation cohort (B). Patients were stratified by the BCLC staging system in the stage (A) and stage B LRR group patients (C), stage (A) and stage (B) patients (D).