Figures & data
Figure 1 Workflow and design of the study.
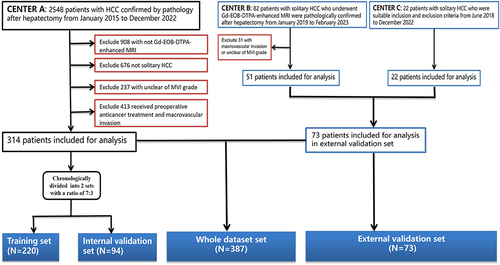
Figure 2 Qualitative and quantitative features of HCC. Peritumoral enhancement (a); radiologic capsule ((b) complete, (c) incomplete); non-smooth margins on HBP (d); smooth margins on HBP (e); quantitative measurement in HBP (f): ROIs (mean area 100 mm2) were applied to measure the tumor signal intensity (SI), normal liver SI and right spinal muscle SI for three times on the tumors largest level of the axial HBP; peritumoral hypointensity in HBP (g).
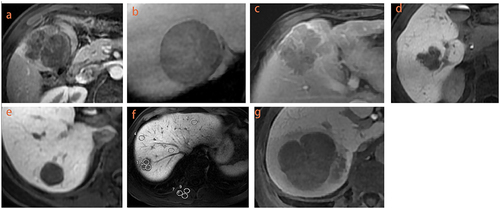
Table 1 The Definitions and Best Cutoff Values of Derivative Biomarkers and MR Quantitative Features for Predicting MVI in Solitary HCC
Table 2 The Baseline Characteristics of the HCC Patients in Different Cohorts
Table 3 Seven Most Important Features Were Selected Through Stepwise Forward Multivariate Logistic Regression
Figure 3 Feature selection path plots of tenfold cross-validation (A) and LASSO regression (B). The dotted vertical line represents the log (Lambda) value (Lambda=0.02257) corresponding to the number of variables of the minimum binomial deviation, where eleven features were included. Heatmaps of correlation coefficients for seven important features (C). Sort the importance of Shapley values for seven important parameters (D).
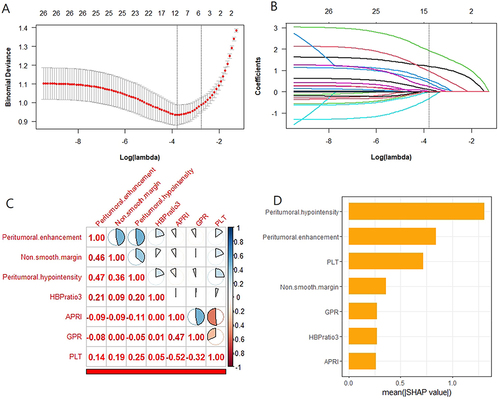
Table 4 Comparison of the Prediction Performance of Multiple Machine-Learning Models for Predicting MVI in Solitary HCC
Figure 4 Comparison of the ROC curves of the six machine-learning models for predicting MVI in training set (A), internal validation set (B), external validation set (C) and whole dataset set (D).
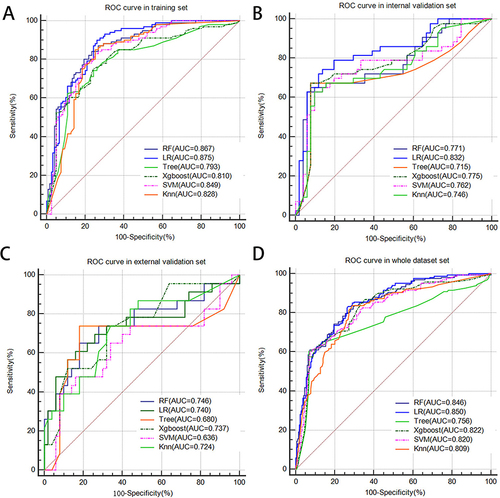
Figure 5 ROC curves of the ENS model for predicting MVI in training set (A), internal validation set (B), external validation set (C) and whole dataset set (D). The calibration curves of ENS in training set (E), internal validation set (F), external validation set (G) and whole dataset set (H). Decision curve analysis of ENS in training set (I), internal validation set (J), external validation set (K) and whole dataset set (L).
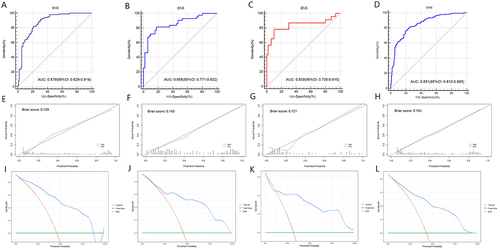
Figure 6 Comparison of the clinical net benefit of the seven models for predicting MVI in training set (A), internal validation set (B), external validation set (C) and whole dataset set (D).
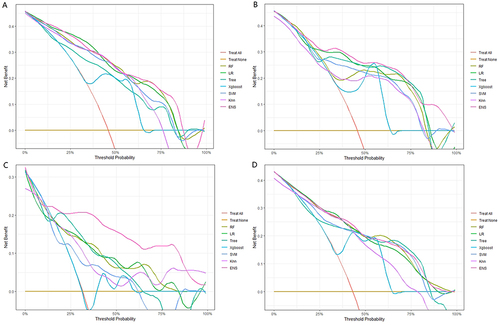
Table 5 The ENS Model Diagnostic Performance for MVI of Different Sizes HCC
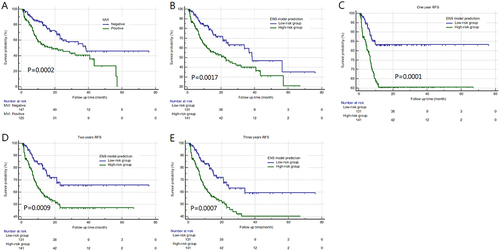
Figure 7 Kaplan–Meier survival curve plots according to pathological results (A) and ENS prediction results (B). The ENS model achieved excellent stratification for MVI high-risk status vs low-risk status of one- (C), two- (D), and three-years RFS (E).