Figures & data
Figure 1 Patient selection process.
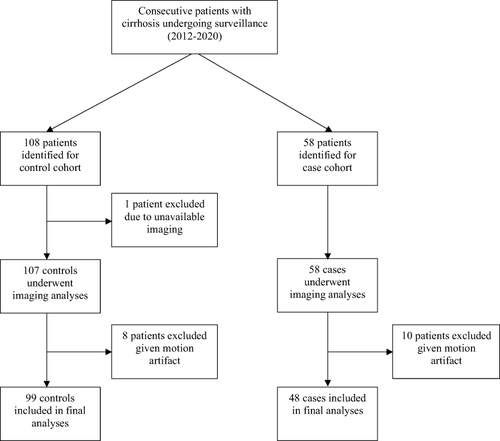
Table 1 Baseline Characteristics of Cases and Controls
Figure 2 Representative ROI used for CNR analysis of the image intensity on EPM (left) and on arterial phase MRI (right) with lesion indicated.
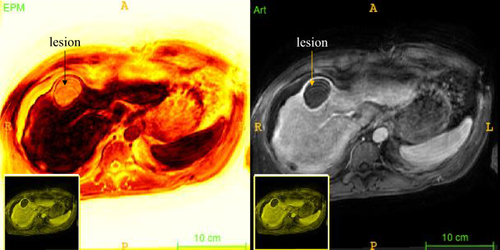
Figure 3 Box plots of EPM RMSD between observed lesions for pre-diagnostic and diagnostic scans in cases. (Left) On pre-diagnostic scans in cases, the median EPM RMSD observed was 0.44 for pre-malignant lesions and 0.22 for parenchyma. (Right) On diagnostic scans, the median EPM RMSD observed was 0.50 for HCC lesions and 0.22 for parenchyma. (Left and right).
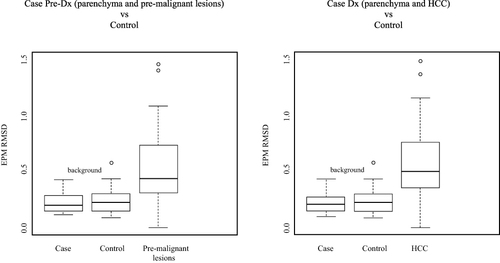
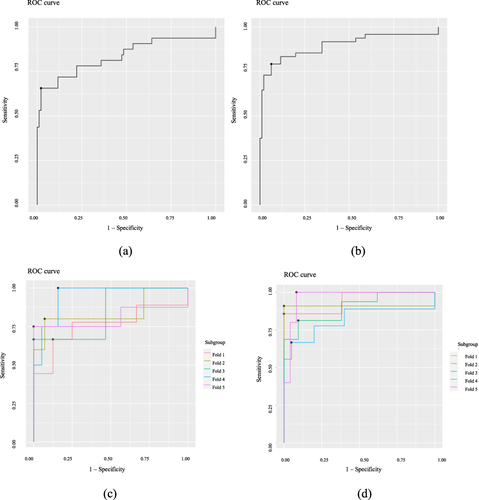
Figure 4 ROC analysis of optimal threshold for discriminating case and control for pre-diagnostic and diagnostic time points. (a) In-sample ROC analysis for EPM RMSD in differentiating cases and controls on pre-diagnostic and single timepoint scans is shown. Similarly, (b) in-sample ROC analysis for EPM RMSD in differentiating cases and controls on diagnostic and single timepoint scans is shown. (c) Five-fold cross validation ROC analysis for EPM RMSD in differentiating cases and controls on pre-diagnostic and single timepoint scans is shown. Similarly, (d) Five-fold cross validation ROC analysis for EPM RMSD in differentiating cases and controls on diagnostic and single timepoint scans is shown.