Figures & data
Table 1 Baseline Characteristics of Patients with Different Serum CXCL9 Levels
Figure 1 Patients with higher serum CXCL9 levels show a better treatment response to anti-PD-1 therapy. (A) Volcano plots showing the genes differentially expressed between responders and nonresponders. The most significantly expressed gene, CXCL9, is highlighted in red. (B) Serum CXCL9 levels in patients with PR, SD and PD HCC. (C) ROC curves for the response to anti-PD-1 therapy plotted according to the serum CXCL9 concentration. (D) Sankey analysis of serum CXCL9 levels and tumor response according to Response Evaluation Criteria in Solid Tumors (RECIST) v1.1. (E) PFS of patients with a serum CXCL9 concentration < ULC, 1~2x ULC or >2x ULC.
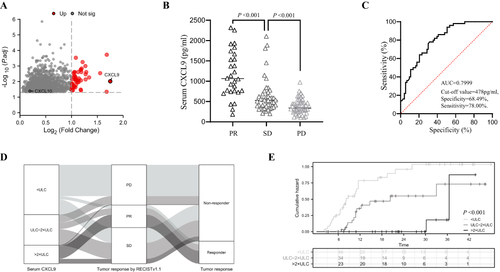
Table 2 Variables Associated with the Response to Anti-PD-1 Therapy in the Training Cohort
Table 3 Comparison of the Baseline Characteristics Between the Training and Validation Cohorts
Figure 2 Establishment of the nomogram for predicting the response to anti-PD-1 therapy (A) Nomogram for the prediction of the response of HCC to anti-PD-1 antibody in the training cohort. B. ROC curves for the nomogram in the training cohort (B) and external validation cohort (E). Decision curves for the nomogram in the training cohort (C) and external validation cohort (F). Calibration curves for the nomogram in the training cohort (D) and validation cohort (G).
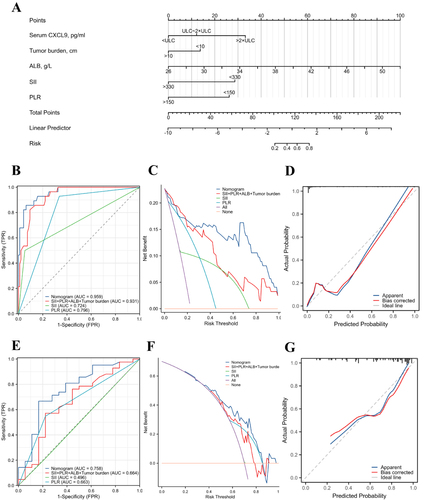
Table 4 Incidence of Response to Anti-PD-1 Therapy in the High-Risk Group and Low-Risk Group in the Training Cohort and Validation Cohort
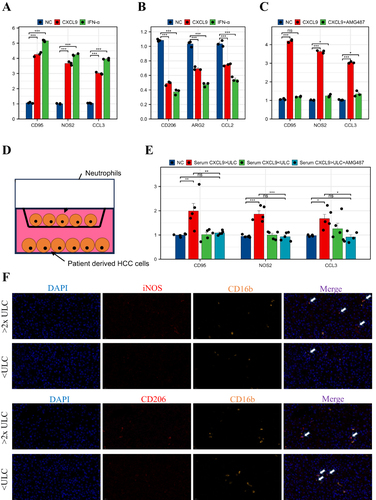
Figure 3 Tumor-derived CXCL9 promotes N1 polarization of neutrophils through CXCR3. (A and B) qPCR analysis of the transcription of N1 and N2 markers in neutrophils treated with or without recombinant human CXCL9 and IFN-α. (C) qPCR analysis of the transcription of N1 markers in neutrophils treated with or without AMG487. (D) Schematic diagram of the coculture of neutrophils and patient-derived HCC cells. (E) qPCR analysis of the transcription of N1 markers in neutrophils cocultured with designated patient-derived HCC cells. (F) Representative mIHC images of stained CD206+CD16b+ cells and iNOS+CD16b+ cells from the high- and low-CXCL9 groups. *P < 0.05; **P<0.01; ***P<0.001.