Figures & data
Figure 1 Profiling to mine potential biomarker for HCC. Volcano plots exhibited all differentially expressed genes in (A) TCGA and (B) GSE54236 cohorts. (C) Purple module in TCGA cohort and (D) pink module in GSE54236 cohort were filtered by the relationship analysis between modules and features. (E) Venn diagram displayed the 43 pivotal genes intersected by DEGs and modules. Screening of (F) LASSO regression coefficients and plotting of (G) prognostic LASSO variable trajectories based on TCGA-LIHC data.
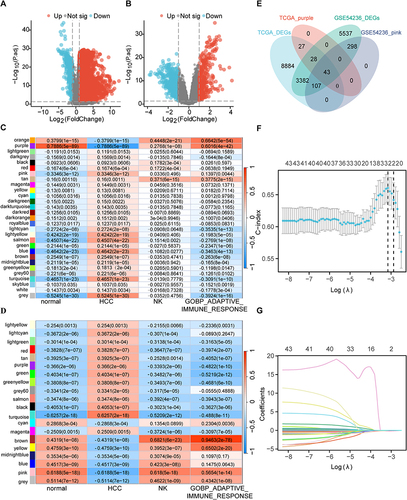
Figure 2 Relationship between PVALB differential expression and prognosis of HCC patients. Kaplan-Meier plotter was employed to draw (A) OS (overall survival), (B) PFS (progression-free survival), (C) RFS (relapse-free survival), and (D) DSS (disease-specific survival) survival curves. (E) Diagnostic ROC curves was used to distinguish the diagnostic value of PVALB.(F) Colonies formed by HCC cells transfected with shRNA targeting PVALB. Statistical chart shows the quantitative analysis of the result of the colony formation assay (**p < 0.01).
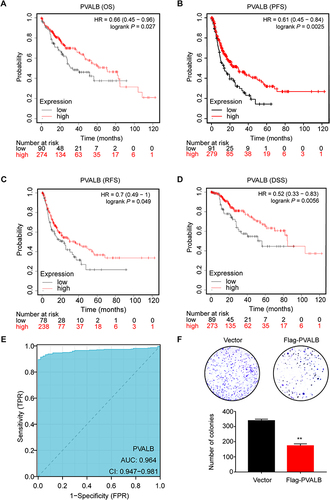
Figure 3 DNA methylation of PVALB in HCC. (A) Heatmap indicated the extent to which CpG sites were methylated. (B) Overall distribution for PVALB methylation sites on chromosome. (C) Localization of CpG sites linked to PVALB. (D) HCC patients had a worse prognosis when the cg25625146 locus was hypermethylated. (E) comparison of methylation level at PVALB cg25625146 site in normal and HCC tissue. (F) SMART database verified that HCC patients had a worse prognosis when hypomethylated at the cg25625146 locus.
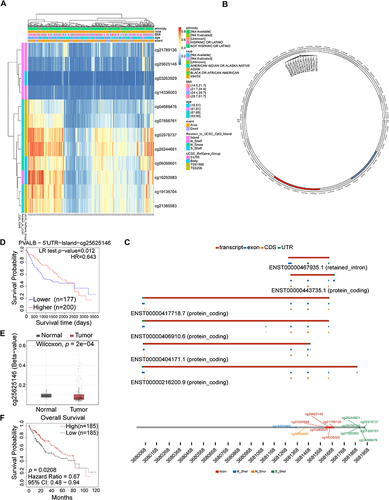
Figure 4 Enrichment analysis of PVALB gene co-expression network in HCC. (A) Volcano plot showed co-expressed genes associated with PVALB expression. (B–C) Lollipop charts showed the top 50 co-expressed genes each with the strongest positive and strongest negative correlation with PVALB expression. (D) Enrichment analysis of Gene Ontology (GO) terms for PVALB co-expressed genes (GO-BP). (E) Enrichment analysis of Kyoto Encyclopedia of Genes and Genomes (KEGG) terms for PVALB co-expressed genes. (F) Eight genes were identified at the intersection of 4519 HCC prognosis factors and 100 genes with the strongest positive and negative correlations with PVALB. (G) Co-expression heatmap displayed the relationship between PVALB and 8 genes. (H) Significant enrichment of the GO and KEGG pathways of the 8 genes.
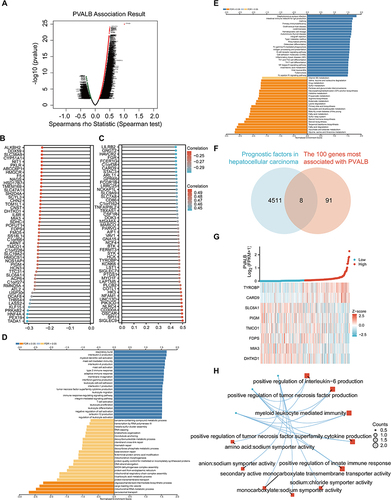
Figure 5 Relationship between PVALB and immune infiltration in HCC. (A–C) Correlation of PVALB expression level with StromalScore, ImmuneScore and ESTIMATEScore was demonstrated by scatter plots based on TCGA-LIHC data. Correlation of PVALB expression with multiple immune cell infiltration based on (D) TCGA-LIHC data and (E) TIMER database. (F) Grouped comparison plot demonstrated the enrichment scores of different immune cells in high and low PVALB expression groups. (***p < 0.001, **p < 0.01, *p < 0.05, ns: non-significant).
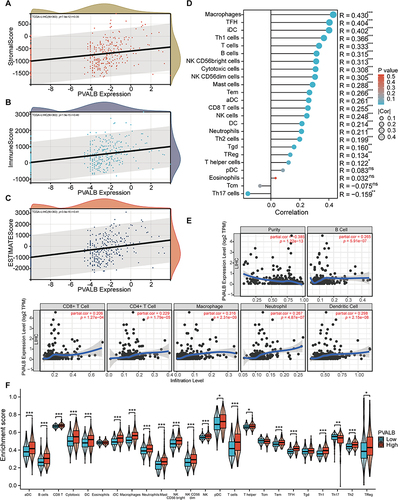
Figure 6 Relationship of PVALB with lymphocytes, MHCs and cytokines as well as their approximate expression level. Correlation of PVALB expression level with (A) lymphocytes (B) MHCs (C) chemokines (D) chemokine receptors in HCC. Expression of PVALB in different (E) molecular subtypes and (F) immunosubtypes in HCC.(**p < 0.01, *p < 0.05).
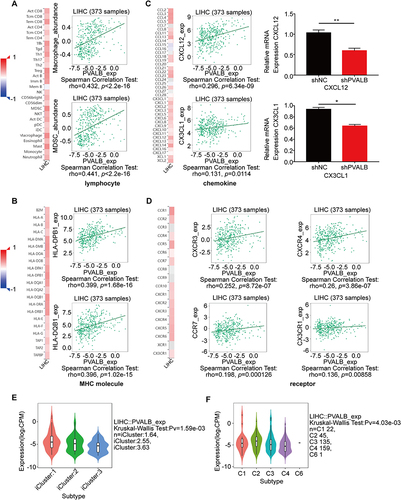
Figure 7 Relationship between PVALB expression and prognosis of HCC patients based on different immune cell subgroups. (A) B cell; (B) CD4+ memory; (C) CD8+ T-cell; (D) Natural killer T-cell; (E) Type 1 T-helper cell; (F) Type 2 T-helper cell; (G) Regulatory T cell; (H) Mesenchymal stem cell; (I) Macrophage.
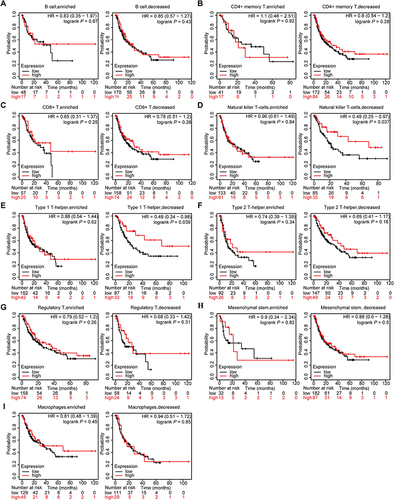
Figure 8 Construction of the ceRNA regulatory network of PVALB in HCC. (A) Venn diagram showed miRNAs jointly predicted by TargetScan and DIANA databases. (B) Correlation of PVALB with hsa-miR-6735-5p. (C) Potential binding sites of PVALB to hsa-miR-6735-5p predicted by TargetScan database. (D) RIP-qPCR showed the enrichment of hsa-miR-6735-5p detected by the PVALB. (E) Potential binding sites of PVALB to hsa-miR-6735-5p validated by the dual-luciferase reporter gene system. (F) mRNA expression level of PVALB under the influence of hsa-miR-6735-5p mimic and (G) hsa-miR-6735-5p inhibitor. (H) Potential binding sites of lnc-YY1AP1-3 to hsa-miR-6735-5p predicted by the LncRNASNP2 database and (I) validated by the dual-luciferase reporter gene system. (J) Expression level of hsa-miR-6735-5p under the influence of lnc-YY1AP1-3 mimic. (K) Protein expression level of PVALB in mock and lnc-YY1AP1-3 groups were explored by Western blot. (L) Changes in protein expression level of PVALB under four different conditions. (M) Changes in the number of colonies in four different groups.(***p < 0.001, **p < 0.01, *p < 0.05, ns: non-significant).
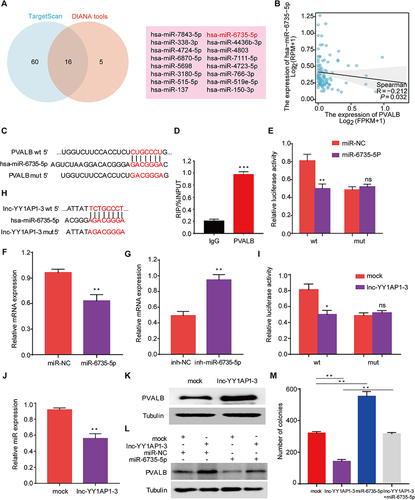
Figure 9 Role of PVALB in immunotherapeutic response. (A) Chordal plot demonstrated the overall connection between PVALB and immune checkpoint genes (B) Heatmap displayed the specific relationship between PVALB expression and 10 immune checkpoint genes (C–E) Scatter plots showed the correlation between PVALB expression and CD244, TIGIT, CD96 (F) Association between PVALB expression and MSI score (G) Box plot demonstrates the difference in TIDE score between high and low PVALB expression groups.(****p < 0.0001, *p < 0.05).
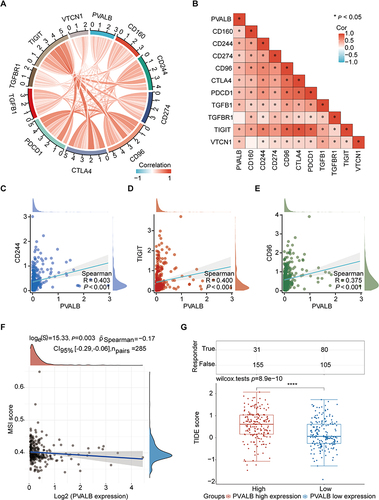
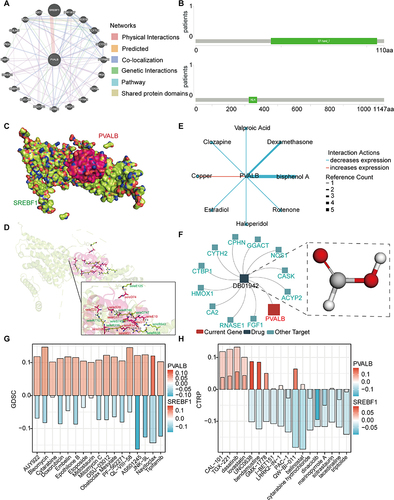
Figure 10 Molecular docking analysis of PVALB and its drug sensitivity analysis. (A) Construction of the interaction network of PVALB with other genes by GeneMANIA database. (B) Protein secondary structures underlying PVALB and SREBF1. (C–D) Molecular docking model of PVALB-SREBF1 (E) Cancer-related drugs from CTD that interact with PVALB. (F) Drugs targeting PVALB studied by TISIDB. Pharmacosensitivity analysis of PVALB and SREBF1 based on the (G) GDSC and (H) CTRP databases (The large column represent PVALB and the small columns represent SREBF1).