Figures & data
Figure 1 Flow of this study.
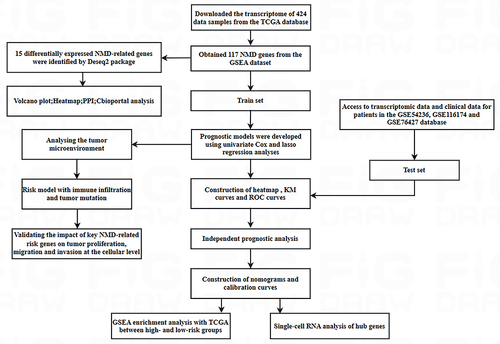
Figure 2 NMD-related genes expressed differentially between LIHC and normal liver tissues. (A) Volcano plot of NMD-related DEGs. (B) Heatmap of NMD-related DEGs. (C) PPI network of interactions among NMD-related genes (interaction score = 0.4). (D) Univariate Cox regression analysis of NMD-related DEGs. (E) Interaction of five DEGs. (F) Mutation analysis of five NMD-related DEGs.
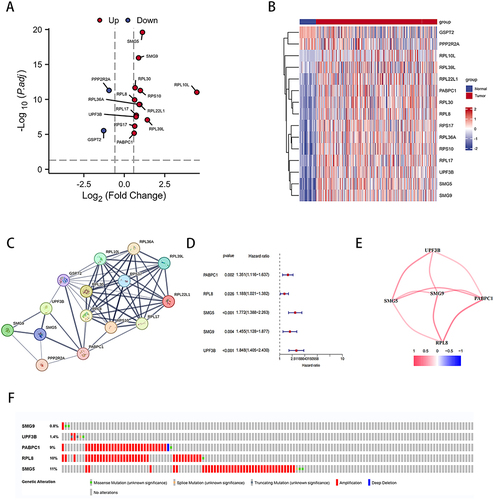
Figure 3 Construction of our risk model based on NMD-related genes in the TCGA-LIHC cohort. (A) LASSO regression of four OS-related genes. (B) Cross-validation for tuning parameter selection in LASSO regression. (C) PCA of our risk model. (D) tSNE analysis of our risk model.
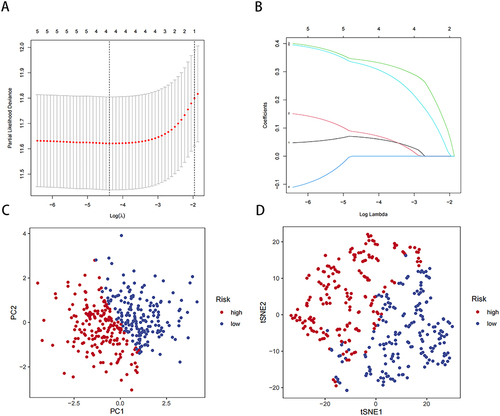
Figure 4 Analysis of risk model and survival. (A) Survival curve for TCGA-LIHC data in high- and low-risk groups. (B) Survival curve for GEO-LIHC data in high- and low-risk groups. (C and D) Distribution of risk scores and the risk profile. (E and F) Distribution of risk scores and the survival status. (G and H) ROC curve analysis.
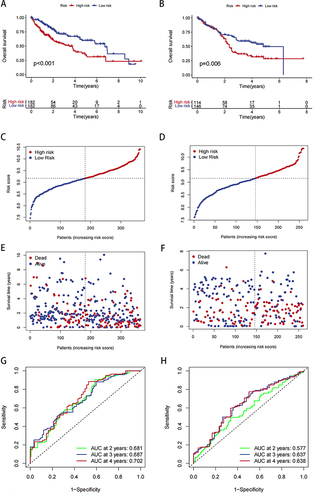
Figure 5 Our risk model and clinical correlation analysis. (A) Correlation analysis of risk scores and age. (B) Correlation analysis of risk scores and gender. (C) Correlation analysis of risk scores and stage. (D and E) Univariate and multivariate Cox analysis of risk scores in liver cancer data. (F) Nomogram combining risk score with pathologic features. (G) Calibration plots for predicting 1-, 3-, and 5-year OS of HCC patients. **P < 0.01, ***P < 0.001.
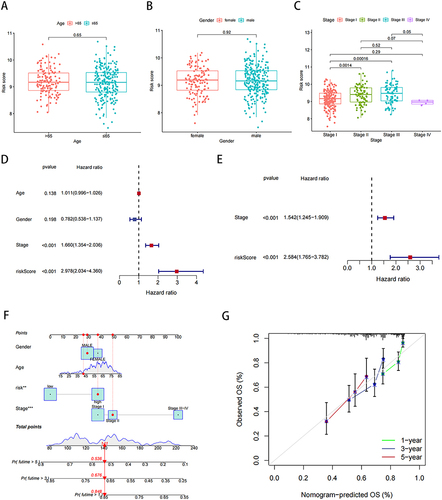
Figure 6 (A and B) GSEA and (C and D) scRNA-seq analysis of SMG5 and UPF3B.
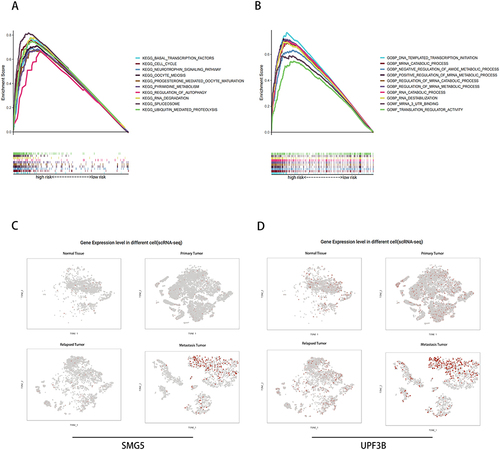
Figure 7 TME and immune cell infiltration analysis. (A) Proportion of immune cell infiltration in high- and low-risk groups. (B) Proportion of immune cell function in high- and low-risk groups. (C) Relationship between model scores and TMB scores. (D and E) Mutation frequency for top 20 genes in high- and low-risk groups. (F and G) Survival analysis of TMB combined with the risk score. *P < 0.05, **P < 0.01, ***P < 0.001; ns, not significant.
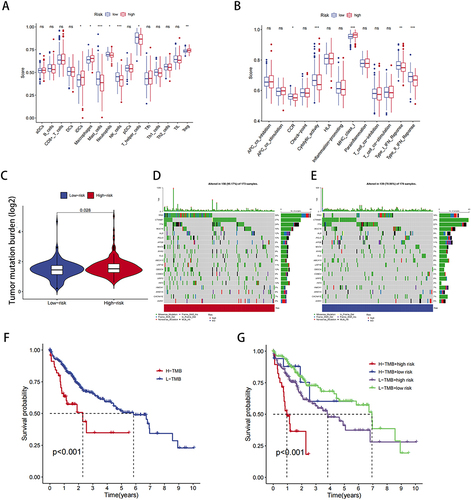
Figure 8 Effects of knockdown of key NMD-related genes on cancer cell migration, invasion, and proliferation. (A) Western blotting for SMG5 and UPF3B knockdown efficiency. (B) CCK-8 and (C) colony formation assay illustrating decreases in proliferation ability of Huh-7 cells after SMG5 and UPF3B knockdown. (D and E) Transwell assay showing decreases in invasive ability of MAHLAVU and Huh-7 cells after SMG5 and UPF3B knockdown. (F–I) Wound healing scratch test illustrating decreases in mobility of MAHLAVU and Huh-7 cells after SMG5 and UPF3B knockdown. (J) The changes in protein levels of the mTOR signaling pathway after knockdown of UPF3B. **P < 0.01, ***P < 0.001.
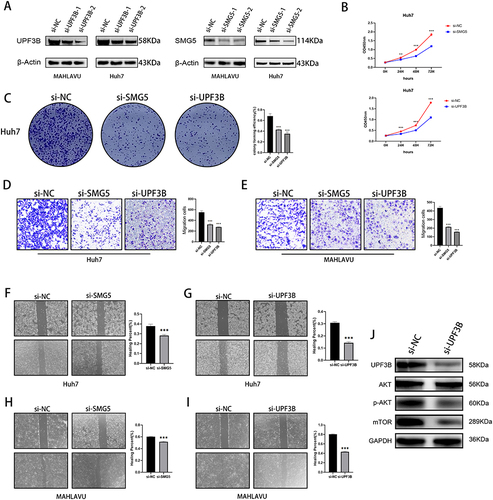
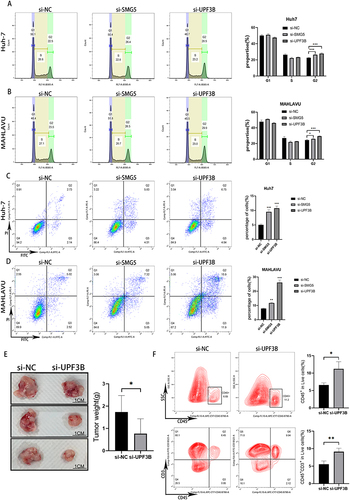
Figure 9 Tumor cell cycle and apoptosis after SMG5 and UPF3B knockdown. (A and B) Changes in the cell cycle of Huh7 and MAHLAVU cells after si-SMG5 and si-UPF3B treatment. (C and D) Changes in apoptosis in Huh7 and MAHLAVU cells after si-SMG5 and si-UPF3B treatment. (E) Tumor weights and representative photographs of resected tumors at sacrifice (n = 3 per group). (F) Percentage of viable tumor-infiltrating CD45+ immune cells and T cells (CD45+CD3+). *P < 0.05, **P < 0.01, ***P < 0.001.