Figures & data
Table 1 Comparison of Baseline Characteristics Between the Training and Validation Cohorts
Figure 1 Screening independent risk factors for OS using LASSO regression analysis.
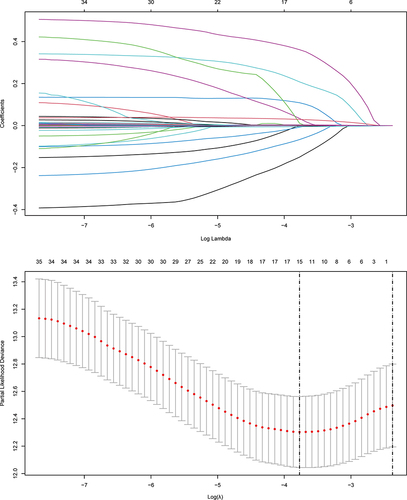
Figure 2 Screening independent risk factors for OS using RSF model.
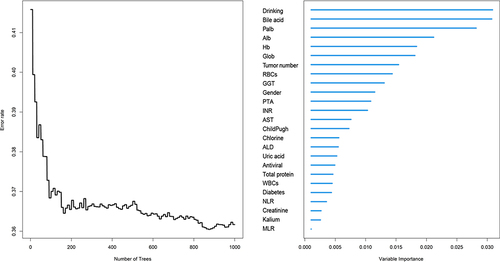
Figure 3 Forest plot display of multivariate Cox regression analysis results.
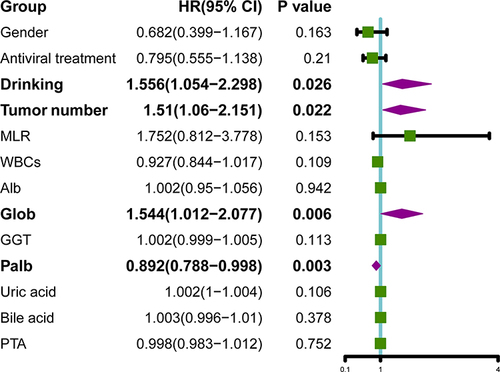
Figure 4 Nomogram developed for predicting 3-, 5-, and 8-year OS of elderly cirrhotic HCC patients undergoing ablation therapy.
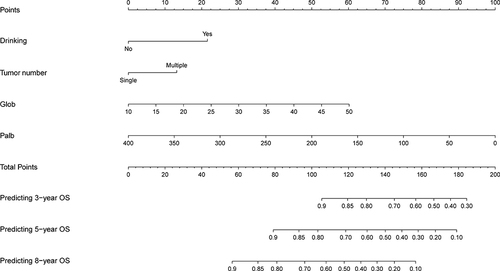
Figure 5 ROC curve analysis of the nomogram for 3-, 5-, and 8-year OS prediction in the training cohort.
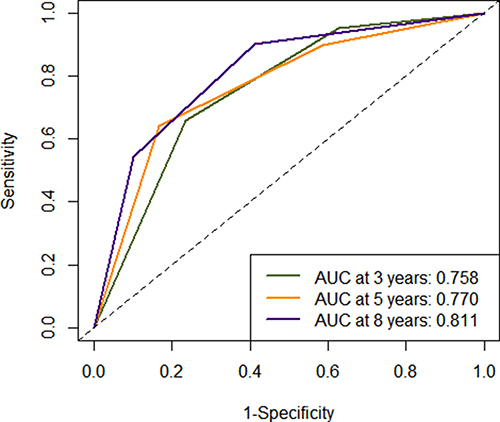
Figure 6 Calibration plots of the nomogram for 3-year (A), 5-year (B), and 8-year (C) OS prediction in the training cohort.
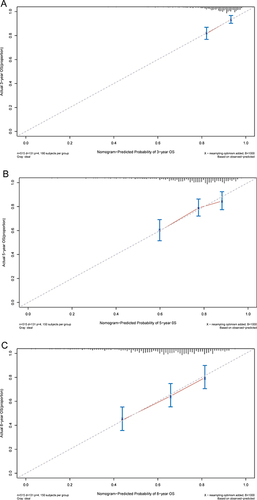
Figure 7 DCA curve analysis of the nomogram for 3-year (A), 5-year (B), and 8-year (C) OS prediction in the training cohort.
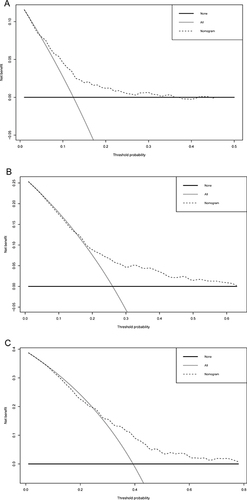
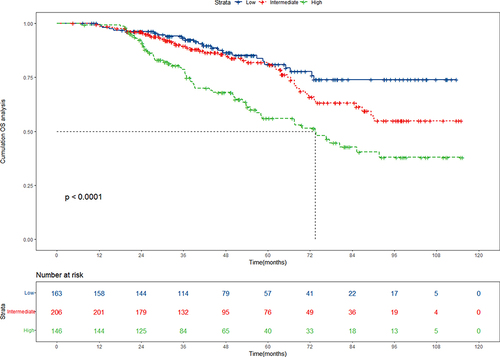
Figure 8 Kaplan-Meier survival curves for OS based on the nomogram-derived low, intermediate, and high-risk groups in the training cohort.