Figures & data
Figure 1 Flow chart of the retrospective study.
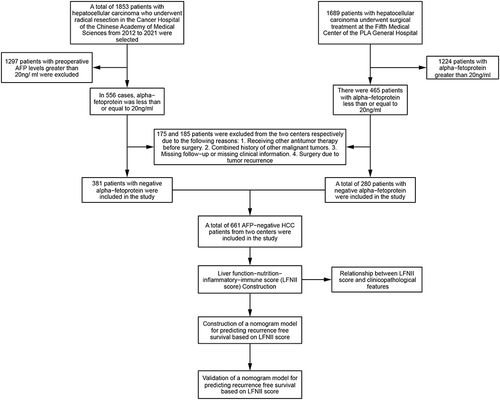
Table 1 Comparison of Clinicopathological Characteristics in Training and Validation Sets
Figure 2 Recurrence-free survival Kaplan–Meier curves of patients with AFP-NHCC using ALRI (A), SIRI (B), ANRI (C), SII (D), PNI (E), GAPR (F), AAR (G), AAPR (H), and ALBI Grades (I). ALRI, aspartate aminotransferase to lymphocyte ratio; SIRI, systemic inflammation response index; ANRI, aspartate aminotransferase to neutrophil ratio; SII, systemic immune-inflammation index; PNI, prognostic nutritional index; GAPR, gamma-glutamyl transpeptidase to alkaline phosphatase ratio; AAR, alanine aminotransferase to aspartate aminotransferase ratio; AAPR, albumin to alkaline phosphatase ratio; ALBI, albumin-bilirubin ratio.
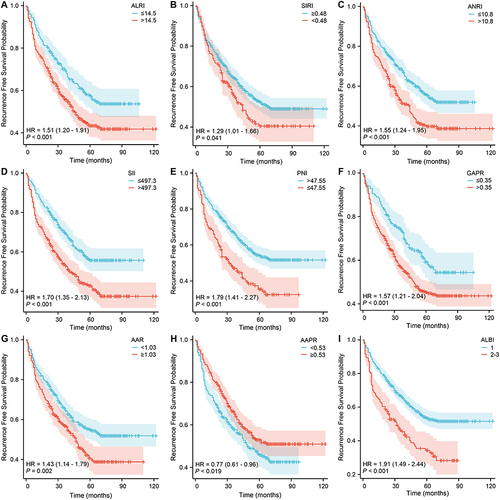
Figure 3 Construction of the LFNII Score using the LASSO Cox Regression Model. (A) LASSO coefficient profiles of the nine features. (B) Optimal parameter (lambda) selection in the LASSO model utilizing ten-fold cross-validation through minimum criteria. Dotted vertical lines indicate the optimal values determined by Lambda.min and Lambda.1 se. (C) Risk factor maps displaying the relationship between the LFNII score and clinicopathological features, highlighting the association of high LFNII scores with poor clinicopathological features and advanced tumor stage. (D-I) Receiver operating characteristic (ROC) curves illustrate the predictive abilities of the LFNII score and the nine indicators for the 1-, 2-, and 5-year RFS in patients with AFP-NHCC postoperatively. LFNII, liver function-nutrition-inflammation-immune; MVI, microvascular invasion; AUC, area under the curve; RFS, recurrence-free survival.
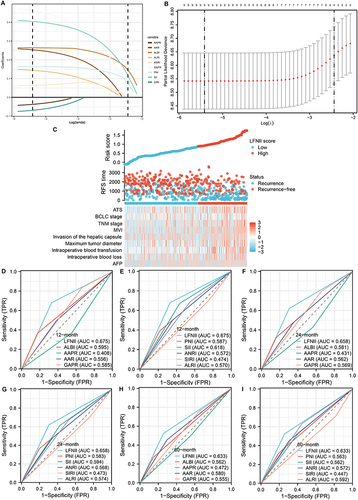
Table 2 Results of Univariate and Multivariate Cox Regression Analysis for RFS in the Training Set
Figure 4 LFNII score-based nomogram model construction and validation. (A) The Kaplan–Meier (KM) curve demonstrates the association of high LFNII with shorter post-operative recurrence-free survival. (B) LFNII score-based nomogram model for predicting postoperative recurrence in patients with AFP-NHCC. (C) LFNII-nomogram receiver operating characteristic (ROC) curve for predicting the 12-, 24-, and 60-month RFS in the training set. (D) ROC curve of the LFNII-nomogram for the 12-, 24-, and 60-month RFS in the validation set. (E) LFNII-nomogram calibration curve: predicted and observed 12-, 24-, and 60-month RFS in the training set. (F) LFNII-nomogram calibration curve: predicted and observed 12-, 24-, and 60-month RFS in the validation set. LFNII, liver function-nutrition-inflammation-immune; MVI, microvascular invasion; AUC, Area Under the Curve; RFS, Recurrence-Free Survival. AFP-NHCC, alpha-fetoprotein-negative HCC.
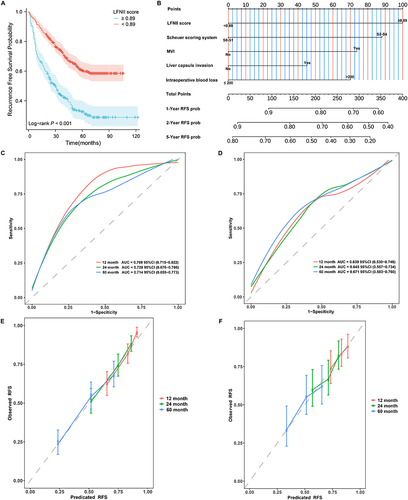
Figure 5 Decision curve analysis (DCA) of recurrence-free survival (RFS) prediction using the LFNII-nomogram and rationality analysis of the nomogram model. DCA of the nomogram, LFNII score, Scheuer Scoring System, MVI, liver capsule invasion, and intraoperative blood loss for 1-year RFS (A), 2-year RFS (B), and 5-year RFS (C) in the training set. DCA of the nomogram, LFNII Score, Scheuer Scoring System, MVI, Liver capsule invasion, and intraoperative blood loss for 1-year RFS (D), 2-year RFS (E), and 5-year RFS (F) in the validation set. Kaplan–Meier curves demonstrated that a high nomogram score was associated with a poor prognosis in the training (G) and validation (H) sets.
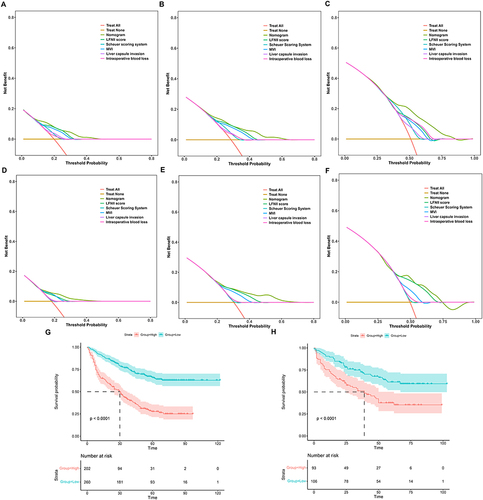
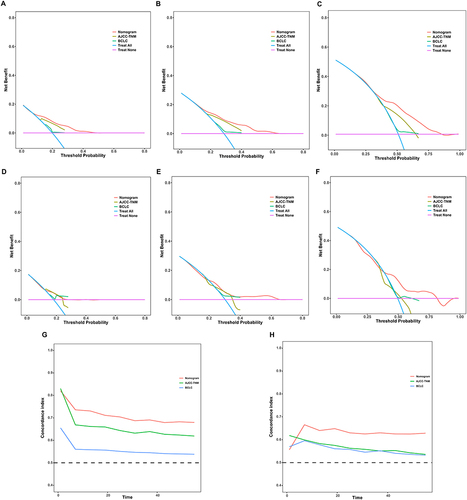
Figure 6 Comparison of the nomogram model with commonly used HCC staging systems. Decision curve analysis (DCA) for 1-, 2-, and 5-year recurrence-free survival (RFS) in the training set (A-C) comparing the nomogram, AJCC-TNM stage, and BCLC stage. DCA curves for 1-, 2-, and 5-year RFS in the validation set (D-F) comparing the nomogram, AJCC-TNM stage, and BCLC stage. Time-dependent area under the curve (AUC) of the LFNII-nomogram, AJCC-TNM stage, and BCLC stage for predicting RFS in the training (G) and validation (H) sets. AUC, area under the curve; AJCC-TNM, American Joint Committee on Cancer tumor–node–metastasis; BCLC, Barcelona Clinic Liver Cancer system.