
Figures & data
Figure 1 Protocol of this study.
Abbreviations: HCC, Hepatocellular carcinoma; HAIC, hepatic arterial infusion chemotherapy; PSM, propensity score matching; OS, overall survival; PFS, progression-free survival; ORR, objective response rate; AE, adverse event.
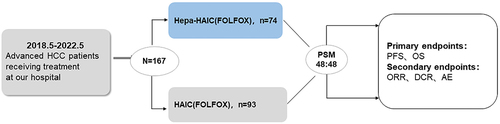
Table 1 Baseline Characteristics of Patients with Advanced HCC (Before PSM)
Table 2 Baseline Characteristics of Patients with Advanced HCC (After PSM)
Table 3 Tumor Response
Table 4 Univariate and Multivariate Analysis of Risk Factors for OS (After PSM)
Table 5 Univariate and Multivariate Analysis of Risk Factors for PFS (After PSM)
Figure 2 Overall survival curves (A) and progression-free survival curves (B) for patients who received Hepa-HAIC and HAIC.
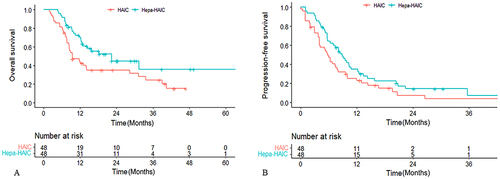
Figure 3 Treatment effect on overall survival (A) and progression-free survival (B) by subgroup.
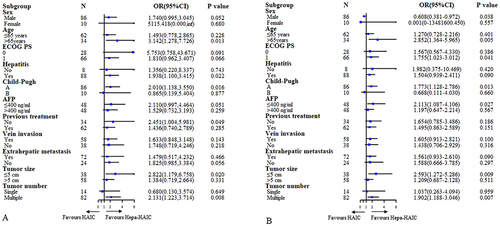
Table 6 Treatment-Related Adverse Events in the Groups (Matched)