Figures & data
Figure 1 Variation in the sorafenib-induced cellular cytotoxicity among hepatoma cell lines. HCC cell lines were seeded on 24 well plates (2 X10⁴ cells/well) in triplicate. After 24 hours, cells were treated with five different concentrations of Sorafenib. After 72 hours of incubation, cell proliferation was determined by MTT assay. (A) Represents the percentage of cell viability of nine different HCC cell lines after sorafenib treatment is shown. (B). Comparison of IC50 values among nine different HCC cell lines tested. (C). Diagram illustrating generation of sorafenib-resistant HCC cell line in culture. Nine different HCC cell lines were cultured in growth medium supplemented with sorafenib for five weeks. HCC cells that survived sorafenib treatment over five weeks were selected as resistant lines. (D). MTT assay shows a dose-dependent effect of sorafenib on cell viability of sensitive cell line (SS Huh 7.5.1) and resistant (SR Huh 7.5) HCC cell line. Sorafenib-resistant and sensitive HCC cells were seeded in 24 well plates and treated the next day with increasing concentrations of sorafenib. After 72 hours, cell proliferation was measured by MTT assay.
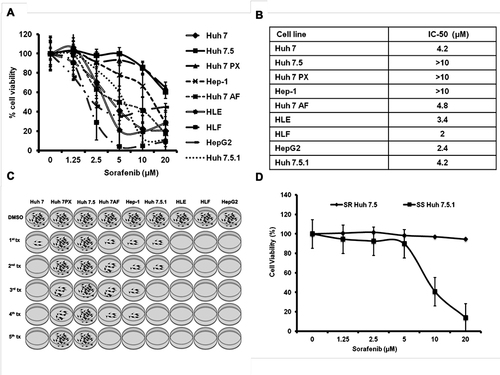
Figure 2 Western blot analysis showing the expression of EGFR and RAS/RAF/MEK/ERK pathway between sorafenib sensitive and resistant HCC cell lines after sorafenib treatment. Cell lines were serum starved overnight and then treated with increasing concentrations of sorafenib for an additional 2 hours. Constitutive basal expression and phosphorylation status of BRAF, CRAF, MEK, and ERK proteins were examined by Western blot analysis. GAPDH level was measured as a loading control. Twenty micrograms of proteins were separated on SDS-PAGE and Western blotting was performed using antibodies to EGFR, BRAF, CRAF, MEK, ERK, and Cyclin D.
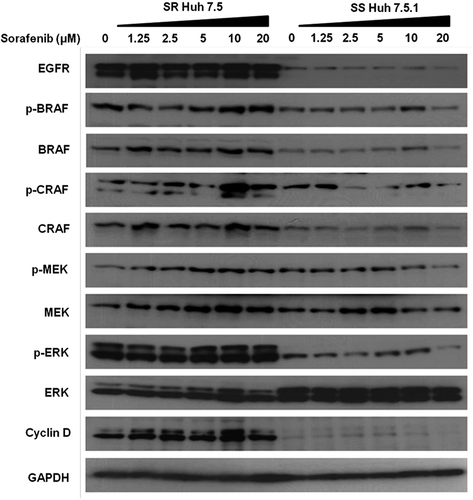
Figure 3 Impaired membrane expression of OCT1 reduced sorafenib uptake in resistant HCC cell line (SR Huh 7.5). Sorafenib uptake between resistant and sensitive cell lines were initiated by the addition of 100μL of cell culture medium supplemented with radiolabeled sorafenib [3H] (specific activity of this is 2.7Ci/mmol) or [3H] cytidine (as a control) at 37°C and 4°C. After 5 minutes of incubation, cells were washed twice with 1 mL of ice-cold PBS. Cell pellets were treated with 100μL of lysis buffer. 40-μL aliquot of soluble protein lysate was mixed with 1mL of scintillation fluid, and radioactivity was measured using a liquid scintillation analyzer. Uptake values were expressed as counts per minute per cell. Specific uptake was determined by subtracting the non-specific reading at 4°C from the total reading at 37°C. (A). Show the sorafenib uptake values between sensitive and resistant cell lines. (B) Western blot shows the expression of drug transporter OCT1, OCT3, CNT1, ENT1, ENT2, and GAPDH expression between all sensitive and resistant cell lines. (C). Immunostaining shows the differences in the membrane expression of OCT1 among primary human hepatocytes (PHHs), and sorafenib resistant (SR Huh 7.5) and all HCC cell lines used in this investigation.
![Figure 3 Impaired membrane expression of OCT1 reduced sorafenib uptake in resistant HCC cell line (SR Huh 7.5). Sorafenib uptake between resistant and sensitive cell lines were initiated by the addition of 100μL of cell culture medium supplemented with radiolabeled sorafenib [3H] (specific activity of this is 2.7Ci/mmol) or [3H] cytidine (as a control) at 37°C and 4°C. After 5 minutes of incubation, cells were washed twice with 1 mL of ice-cold PBS. Cell pellets were treated with 100μL of lysis buffer. 40-μL aliquot of soluble protein lysate was mixed with 1mL of scintillation fluid, and radioactivity was measured using a liquid scintillation analyzer. Uptake values were expressed as counts per minute per cell. Specific uptake was determined by subtracting the non-specific reading at 4°C from the total reading at 37°C. (A). Show the sorafenib uptake values between sensitive and resistant cell lines. (B) Western blot shows the expression of drug transporter OCT1, OCT3, CNT1, ENT1, ENT2, and GAPDH expression between all sensitive and resistant cell lines. (C). Immunostaining shows the differences in the membrane expression of OCT1 among primary human hepatocytes (PHHs), and sorafenib resistant (SR Huh 7.5) and all HCC cell lines used in this investigation.](/cms/asset/a2617ae9-97da-41c8-bcdc-a667e99717ba/djhc_a_12302595_f0003_c.jpg)
Figure 4 Stable expression of OCT1 in a resistant HCC cell line enhanced sorafenib uptake and induced cytotoxicity. (A). Immunostaining shows a very clear membrane expression of OCT1 in stable transfected cells. No membrane staining was present in the sorafenib-resistant cell line (SR Huh 7.5). (B). Western blot where samples were run in duplicate confirms absence of OCT1 expression in sorafenib-resistant cell line. (C). Giemsa staining of HCC culture treated with sorafenib induced efficient cell killing after one week. (D). MTT assay results of resistant HCC cell line with or without OCT1 expression after sorafenib treatment. (E). Sorafenib uptake between resistance HCC cell line with or without OCT expression (**p<0.002).
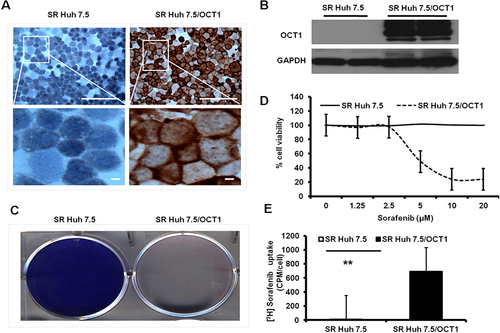
Figure 5 Sorafenib cytotoxicity of SR Huh 7.5 cells after adenoviral gene transfer of organic cation transporter-1 (OCT1). (A). Adv-CMV construct. (B). Western blot showing robust expression of OCT1 in SR Huh 7.5 cells after infection with recombinant AdCMV-OCT1. AdCMV-LacZ infected cells show negative OCT1 expression. Only baseline expression of truncated OCT1 (C). Sorafenib cytotoxicity after OCT1 expression and lacZ gene expression by recombinant adenovirus. In brief, 1×10⁵ SR Huh 7.5 cells were seeded in 24-well plate and then infected with AdCMV-OCT1 or AdCMV-LacZ. After 24 hours of infection, cultures were treated with sorafenib for an additional 24 hours. Cytotoxicity was measured by MTT assay and cell colony assay. (D). Cell colony assay showing cell proliferation in the presence of sorafenib after infection with AdCMV-LacZ. (E). Cell colony assay showing SR Huh 7.5 cell proliferation in the presence of sorafenib after infection with AdCMV-OCT1.
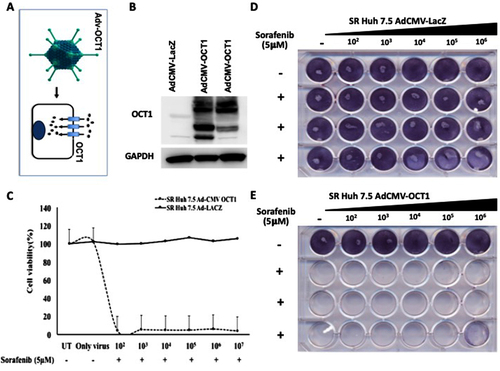
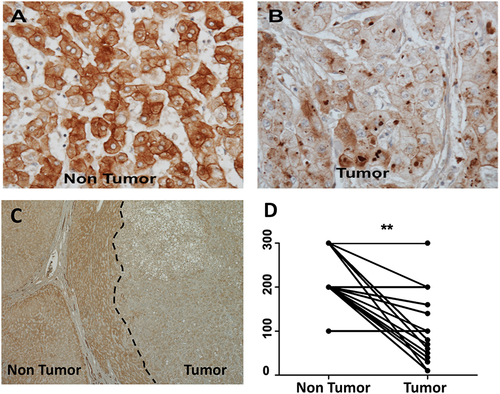
Figure 6 Expression of organic cation transporter-1 (OCT1) in human hepatocellular carcinoma and surrounding non-tumorous hepatocytes. The expression of OCT1 was confirmed using formalin-fixed, paraffin-embedded samples of 20 human HCC samples by immunohistochemistry using a standard protocol. Immunohistochemical staining of OCT1 was evaluated by two independent pathologists (Dr. Moroz and Dr. Wu), who scored staining pattern as 0 having no staining at all, 1 with weak staining, 2 with medium staining, and 3 with strong staining. By multiplying the intensity of score and the proportion of positive cells (0–100%), a semi-quantitative score ranging from 0–300 was calculated. (A). Show OCT1 expression in non-tumorous hepatocytes in the cirrhotic liver (Case number 16, magnification of 40X) (B). Negative OCT1 expression in hepatocellular carcinomas (tumor) (C). Low magnification images (4X, case number 16) showing expression of OCT1 in non-tumorous hepatocytes and HCC tumors show negative OCT1 expression. (D). The staining scores for OCT1 are significantly lower in HCC tissues than the corresponding non-tumorous liver (**p<0.0022).
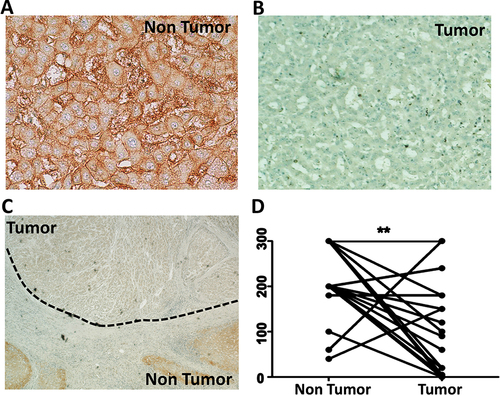
Figure 7 Expression of organic cation transporter-3 (OCT3) in human HCC. Immunostaining of OCT3 in HCC and surrounding non-tumorous area in the 20 human liver specimens. (A) Representative images of OCT3 staining by immunostaining and hematoxylin counterstaining showing a strong membrane expression in non-tumorous cirrhotic liver (Case number 9, magnification of 40X). (B). Representative image showing loss of OCT3 expression in HCC (Case number 9, magnification of 40X) (C). Low magnification images (case number 9, magnification of 4X) show expression of OCT3 in non-tumorous cirrhotic hepatocytes, and most of the HCC tumors show reduced OCT3 expression. (D). The staining intensity scores for OCT3 expression in 20 HCCs and surrounding non-tumorous cirrhotic livers (**p<0.001).